Summer Internship · 2024
Radiation Dose and Neutron Flux Evaluation on COMET Phase-I Electronics Using Geant4 Simulation
Overview
The COMET (COherent Muon to Electron Transition) experiment at J-PARC, Japan, searches for the lepton-flavour-violating decay μ → e with unprecedented sensitivity — a signal that would be unambiguous evidence for physics beyond the Standard Model. To achieve this sensitivity, COMET Phase-I must operate a 3.2 kW, 8 GeV proton beam equivalent to 2.5×10¹² protons-on-target (POT) per second for extended periods. The intense secondary particle environment that results poses a serious radiation-hardness challenge for the front-end electronics mounted close to the beam.
This project used the ICEDUST Monte Carlo simulation framework — a COMET-specific Geant4 application — to map the radiation dose (in Gray) and neutron fluence (per cm²) received by four classes of electronics over 150 days of nominal operation. The targets studied were the CTH trigger hodoscope scintillators, the RECBE readout boards, the CyDet Electronics Room inside a polyethylene shield, and the remote Electronics Hut at the edge of the experiment hall. The results provide a quantitative basis for deciding which components need additional shielding, relocation, or radiation-hardened replacements before the experiment runs.
Background: The COMET Experiment
COMET searches for the coherent process μN → eN on aluminium nuclei. The experiment uses a pulsed muon beam stopped in the aluminium target at the centre of the CyDet (Cylindrical Detector) solenoid. The CDC (Cylindrical Drift Chamber) and CTH (Cylindrical Trigger Hodoscope) surround the target and measure charged particles produced in the stopping region. Downstream of the CyDet, RECBE (Readout Electronics for the CDC Back-End) boards amplify and digitise the signals before transmission to the counting room.
At the beam power levels required for Phase-I, the secondary neutron, gamma, electron, and proton backgrounds are intense enough to deposit hundreds of Gray in the most-exposed electronics within a single run period. At those doses, standard commercial electronics fail: the total ionising dose (TID) limit for many FPGAs and ASICs is of order 10–100 Gy. Understanding the spatial distribution of the dose — which face of a shield is hottest, which radial layer of the RECBE ring is most exposed — is essential before a protection strategy can be designed.
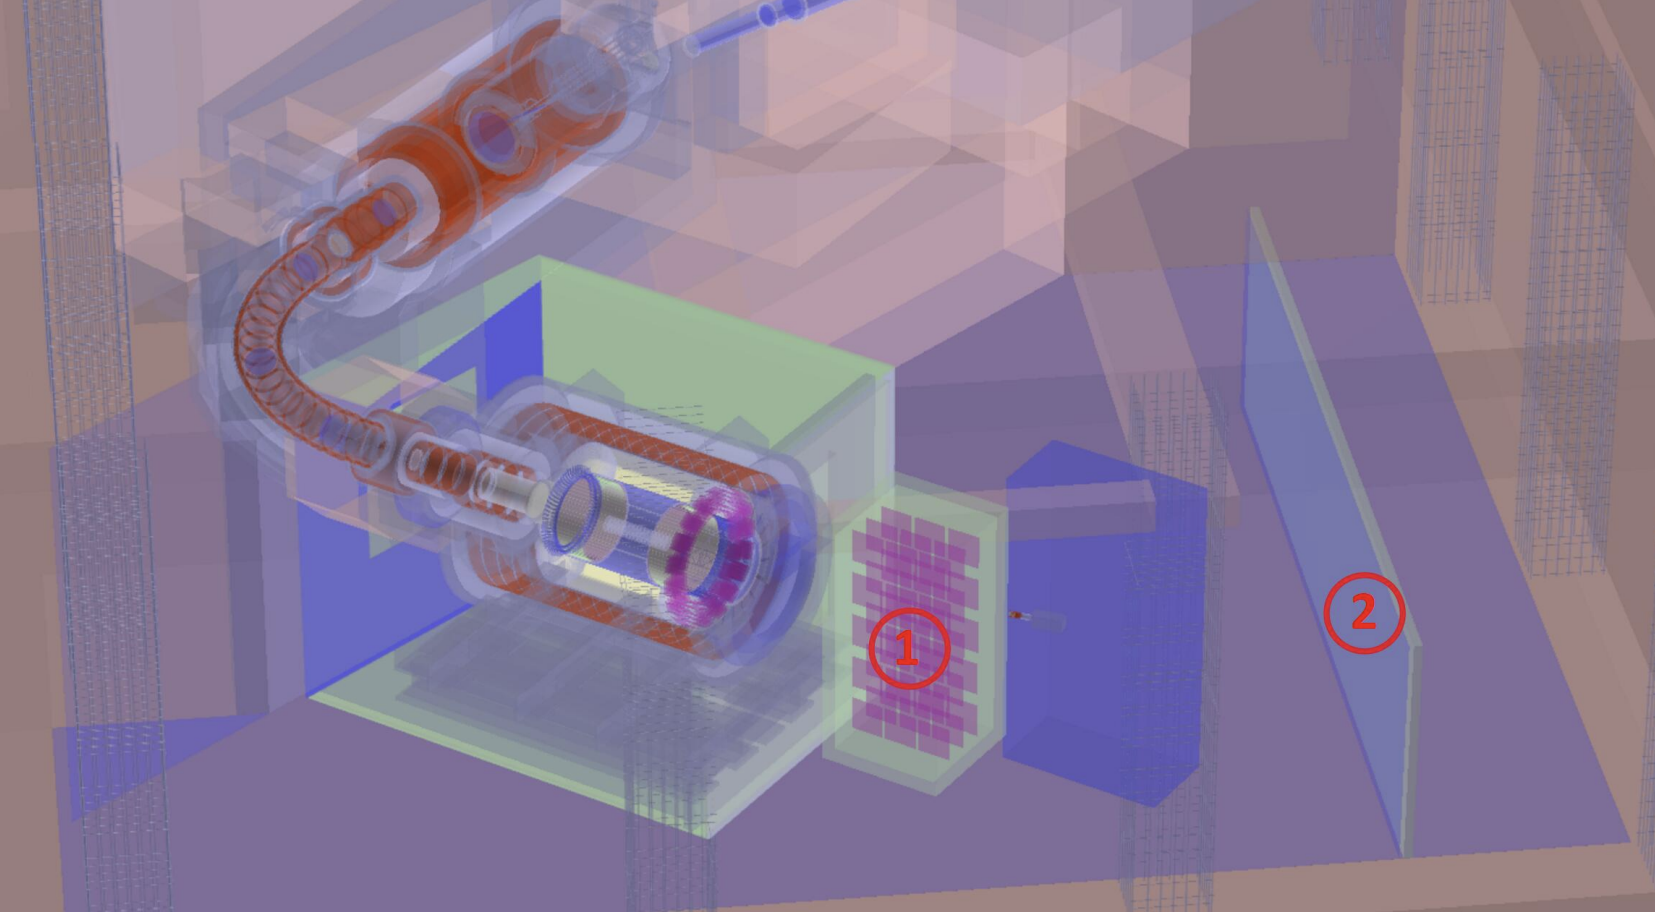
Electronics Under Study
Four detector/electronics subsystems were investigated, each with a different proximity to the beam and a different geometric complexity.
| Component | Location | Material | Key Dimensions |
|---|---|---|---|
| CTH Scintillators | Both ends of CDC, 4 rings (upstream/downstream × inner/outer) | Scintillator | Inner: 368 × 80 × 5 mm, 0.151 kg; Outer: 340 × 88 × 10 mm, 0.306 kg; 64 per ring |
| RECBE Boards | Immediately downstream of CDC, 6 concentric rings | G10 PCB | 170 × 200 mm, 0.110 kg; rings 0–1: 16 boards; rings 2–5: 18 boards |
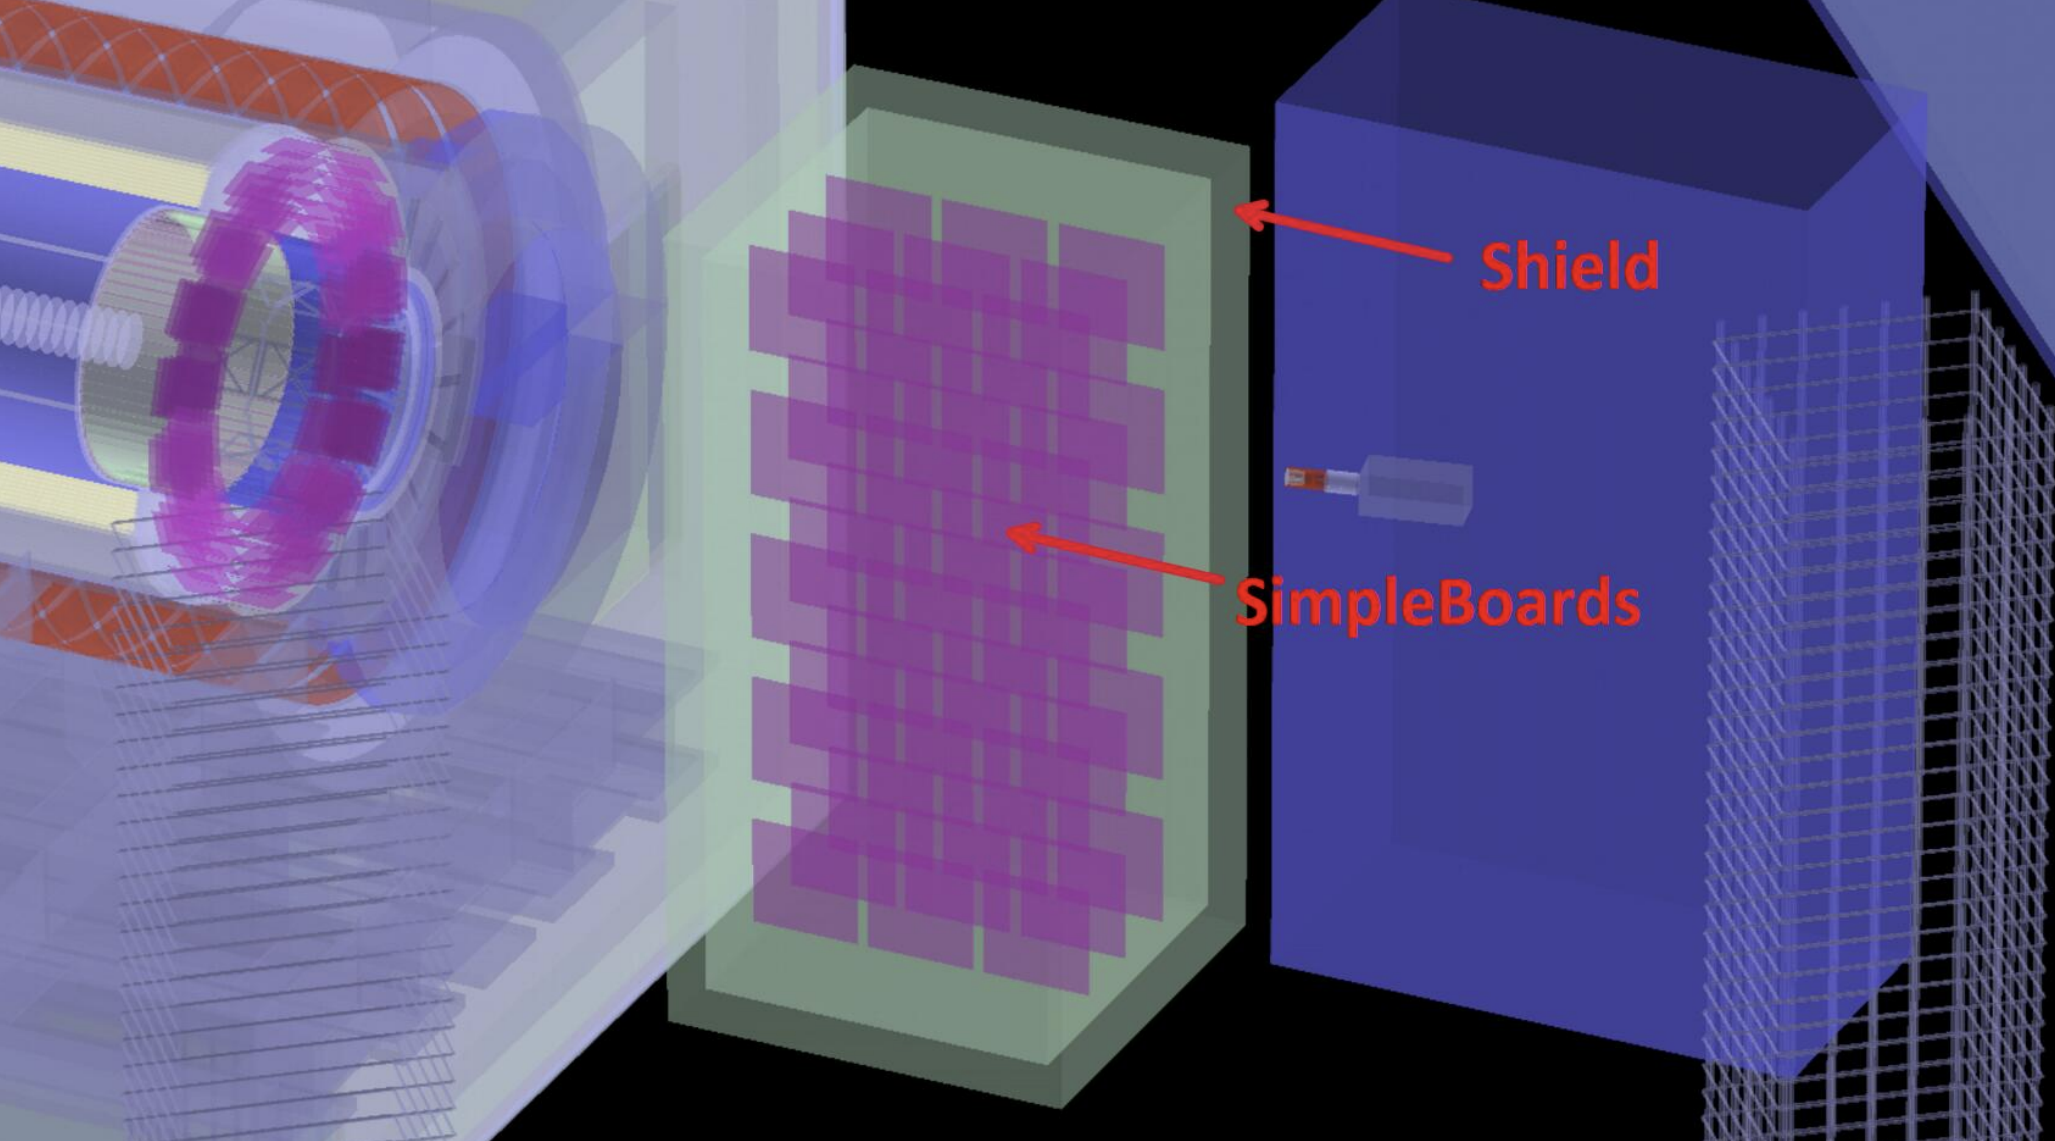
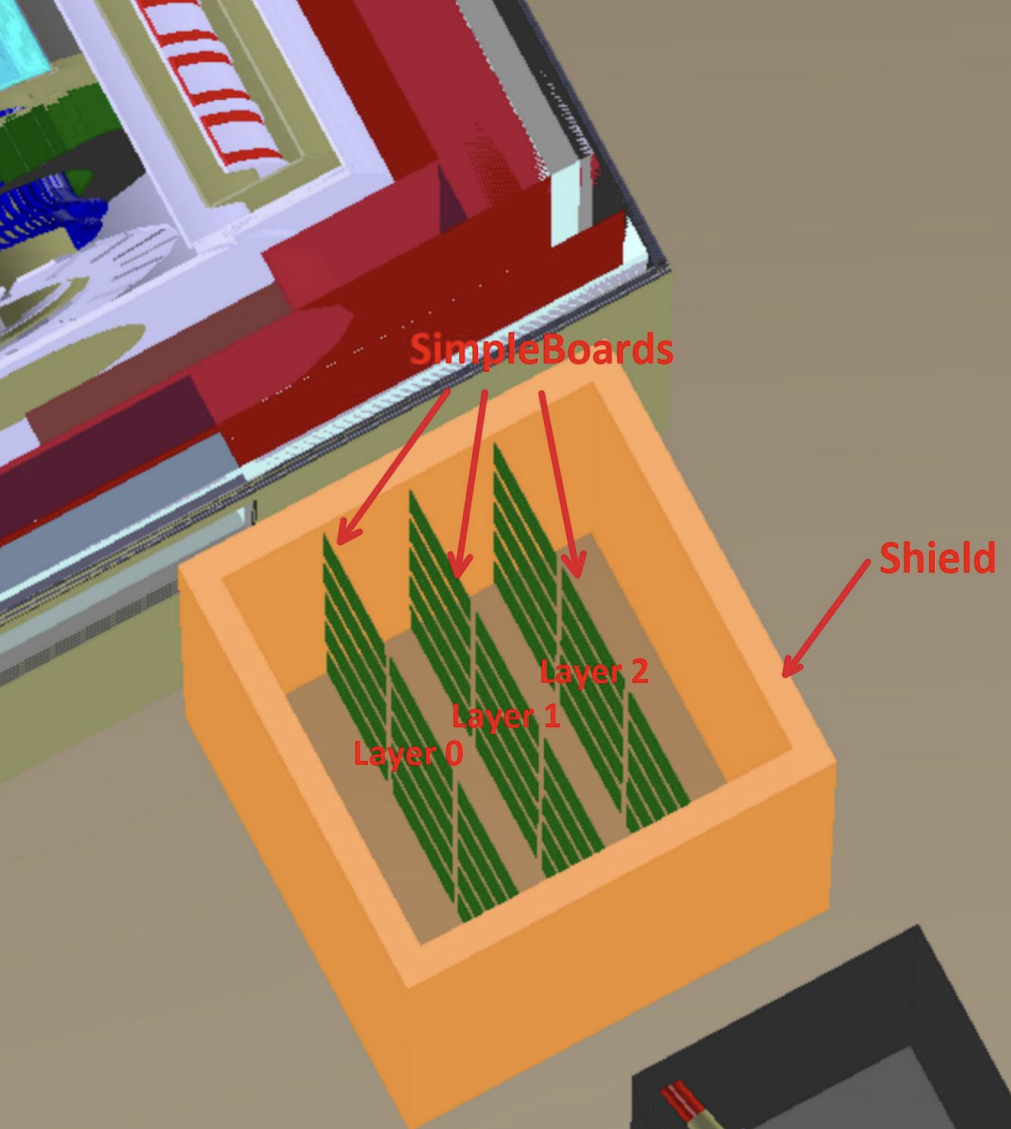
| CyDet Electronics Room | At the end of the CyDet, inside a polyethylene shield | PE shield + G10 boards | Shield: 1.5 × 1.5 × 3 m³, 10 cm thick; 45 SimpleBoards: 400 × 400 × 3.2 mm, 0.435 kg each |
| Electronics Hut | Corner of the experiment hall, far from beam | PE wall | 10 × 0.1 × 2.75 m³, 2585 kg |
Simulation Setup
The simulation used a two-stage pipeline to propagate the proton beam all the way to the downstream electronics, a split necessary because the full geometry is too expensive to run in a single pass.
Stage 1 — Upstream
The 8 GeV primary proton beam is tracked from the target through the pion capture solenoid and the muon transport section using the Phase-I-Sampling world geometry. Particles that reach a sampling plane at the entrance to the CyDet are written to rootracker files. Approximately 30,000 parallel tasks of 5,000 POT each were submitted to the KEKcc computing cluster, producing 16,404 usable files — ~8.2×10⁷ POT in total.
Stage 2 — Downstream
The rootracker files seed a second simulation in the Phase-I-CyDet world, which includes the CDC, CTH, RECBE boards, CyDet Electronics Room, and Electronics Hut. Hit information (position, momentum, particle ID, energy deposit) is recorded in ROOT TTrees by a custom C++ analyser (analyser_7.cxx) for each of the eleven detector volumes.
Dose scaling: The simulated energy deposit per POT is scaled to a full 150-day run assuming 2.5×10¹² POT/s (3.2 kW beam of 8 GeV protons), giving Gray = (ΣdE [J/POT]) × (2.5×10¹² × 86400 × 150) / mass [kg].
Analysis Code
Three ROOT/C++ macros performed the post-processing. myMacro.C computed the integrated radiation dose and neutron flux for each subsystem. draw_plots_1.C produced 2D spatial dose maps (x–y, z–y, z–x projections) and neutron flux distributions. draw_hist_1.C generated per-particle-species energy deposition bar charts and kinetic energy distributions. All macros read a consolidated ROOT file (analyse_7_SegmentRECBE.root) built from the 16,404 downstream simulation outputs.
Results: CTH Trigger Hodoscope
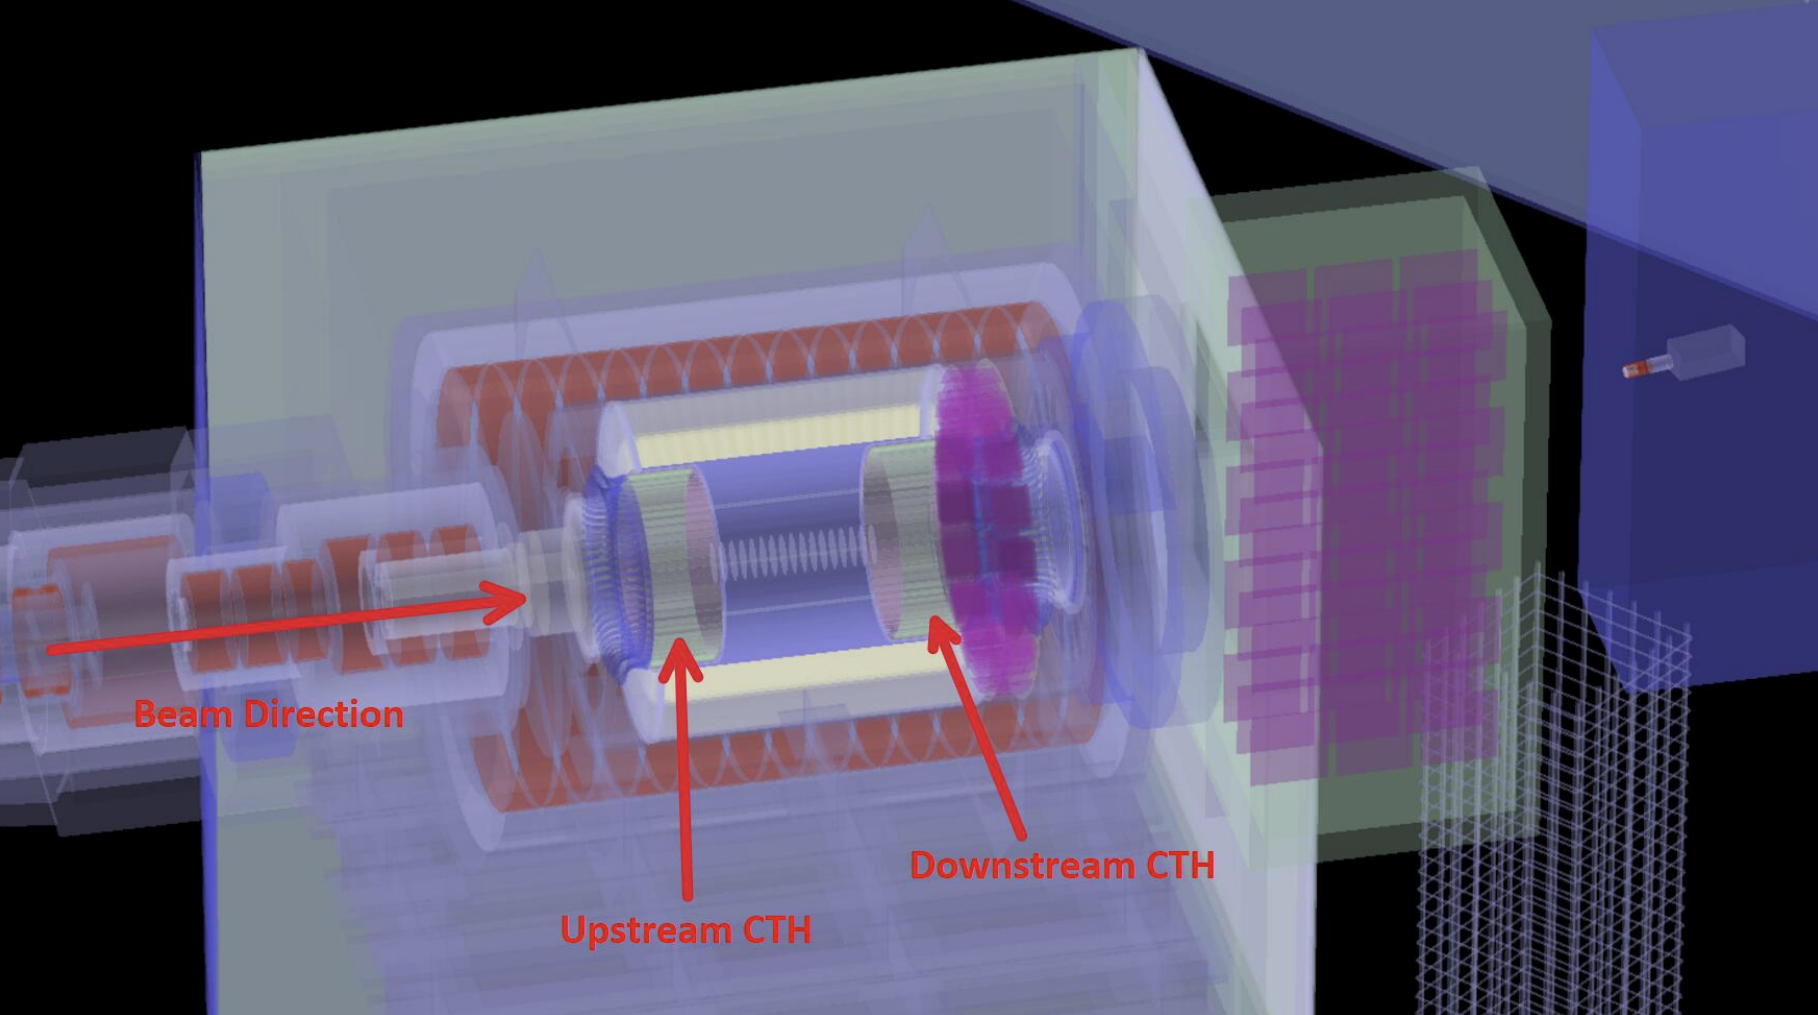
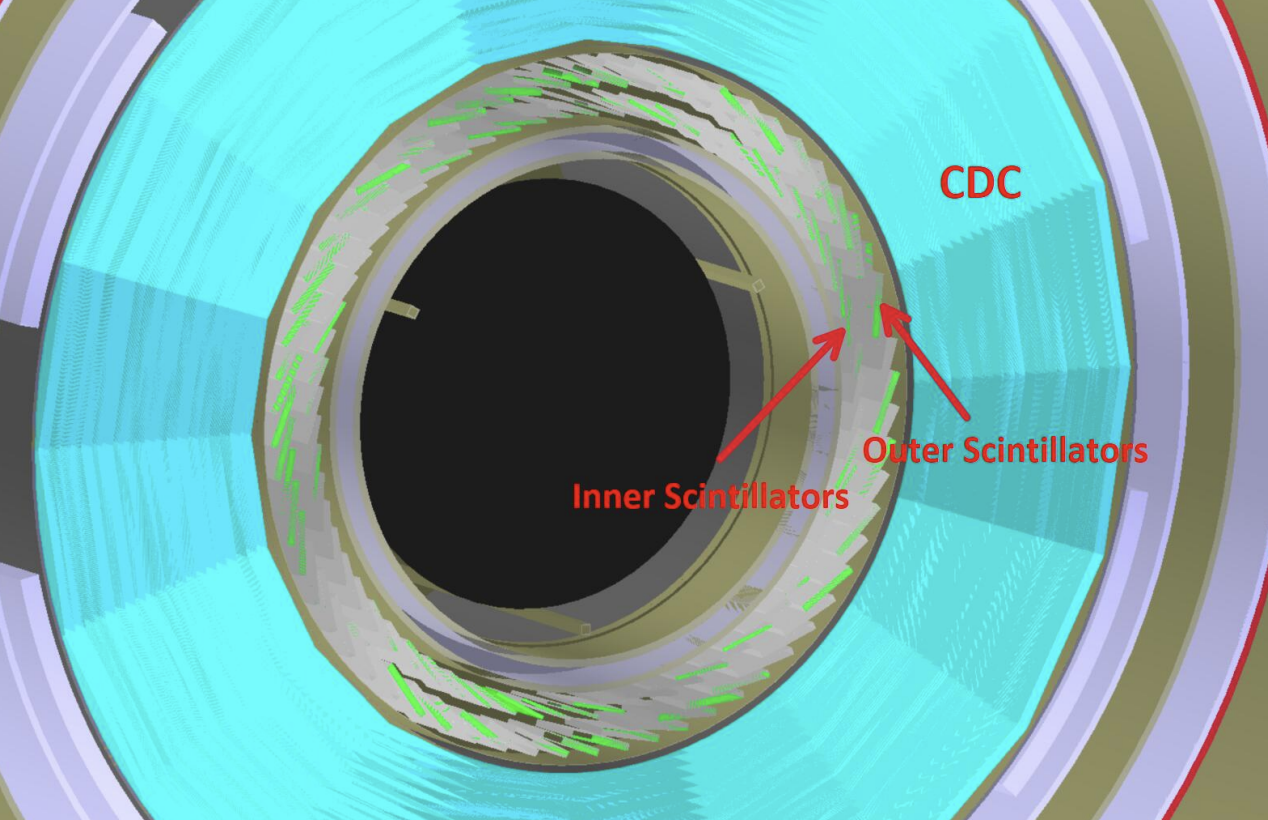
The CTH scintillators form two rings at the upstream and downstream faces of the CDC. Within each ring, an inner layer (radius ~410 mm) and outer layer (radius ~460 mm) are distinguished. The dominant dose contributors are electrons and protons; the dose is roughly uniform in both the x-direction and azimuth φ for the upstream rings, but is concentrated toward lower x-values for the downstream rings, reflecting the asymmetric particle flux from the CDC exit region.
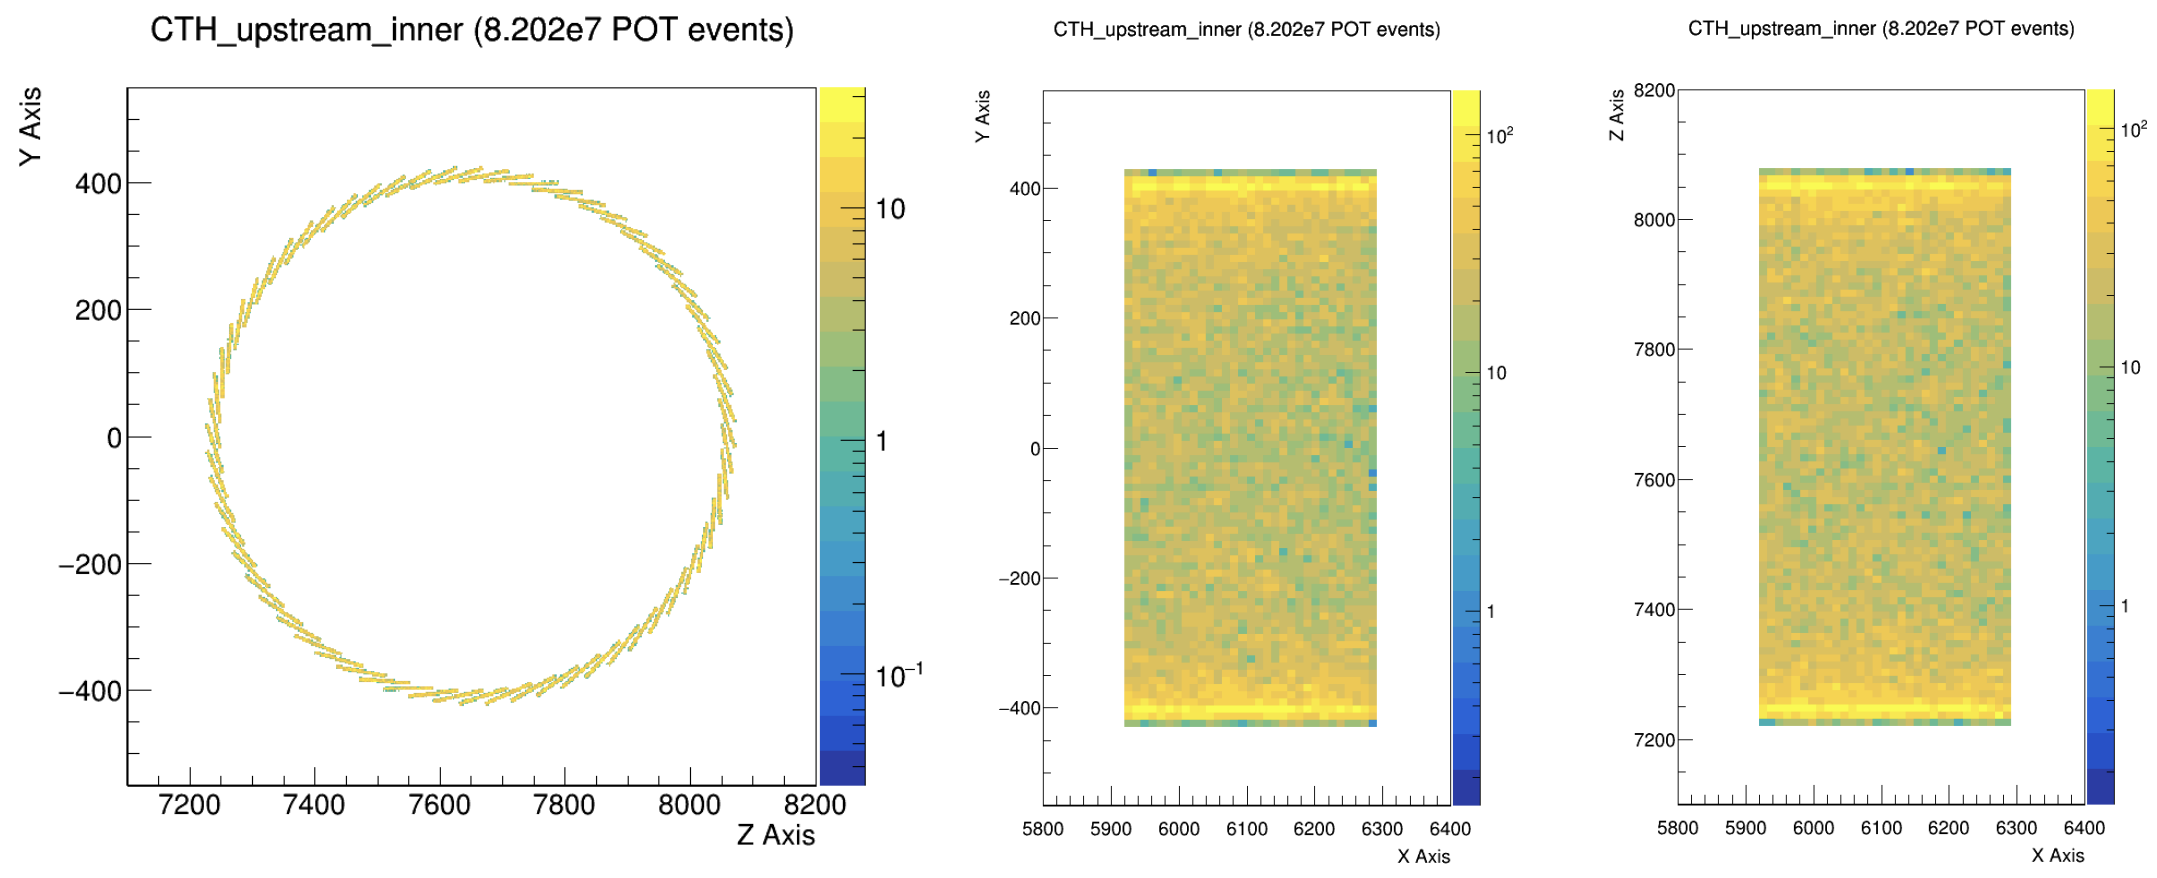
CTH dose summary (150 days): Inner upstream 15.64 ± 0.06 Gy · Inner downstream 25.7 ± 0.1 Gy · Outer upstream 13.72 ± 0.04 Gy · Outer downstream 23.82 ± 0.07 Gy. Downstream rings receive ~65% more dose than upstream rings due to the higher secondary flux exiting the CDC.
CTH neutron fluence (150 days): Upstream inner 1.27×10¹² · Upstream outer 9.86×10¹¹ · Downstream inner 6.58×10¹¹ · Downstream outer 6.43×10¹¹ per cm². Neutron flux is highest at the upstream inner ring, closest to the muon stopping target. The flux is uniform in both X and φ across all four rings.
Results: RECBE Readout Boards
The six concentric RECBE rings are mounted immediately downstream of the CDC. The innermost rings (layers 0 and 1, each with 16 boards) sit at a radius of ~550–630 mm and receive the highest dose; the outermost rings (layers 2–5, 18 boards each) extend to ~835 mm. The dose decreases monotonically from layer 0 to layer 4, with a slight upturn at layer 5, likely due to geometry effects at the outermost radius.
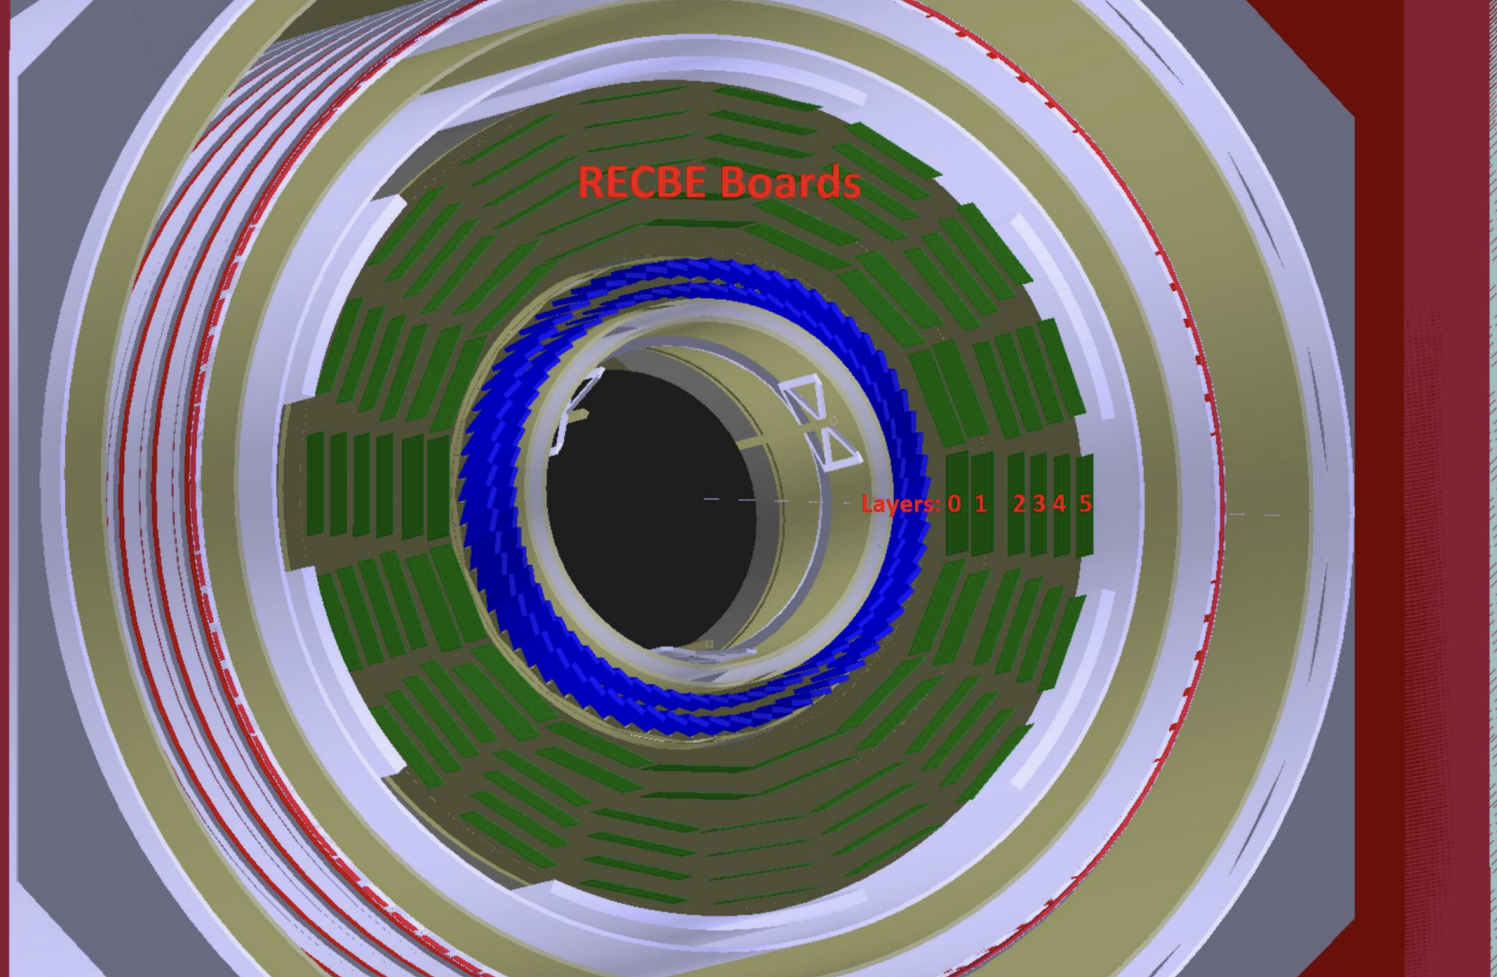
| RECBE Layer | Radius (mm) | Boards | Dose over 150 days (Gy) | Neutron flux / cm² |
|---|---|---|---|---|
| 0 (innermost) | < 570 | 16 | 47.3 ± 0.6 | 4.96 × 10¹¹ |
| 1 | 570 – 630 | 16 | 37.8 ± 0.5 | 4.78 × 10¹¹ |
| 2 | 630 – 685 | 18 | 33.8 ± 0.4 | 4.61 × 10¹¹ |
| 3 | 685 – 735 | 18 | 29.7 ± 0.4 | 4.52 × 10¹¹ |
| 4 | 735 – 785 | 18 | 25.8 ± 0.4 | 4.55 × 10¹¹ |
| 5 (outermost) | > 785 | 18 | 26.3 ± 0.4 | 4.60 × 10¹¹ |
At 47 Gy, the innermost RECBE layer substantially exceeds typical TID thresholds for commercial electronics. The neutron fluence (~5×10¹¹/cm²) is also in the range where silicon device degradation becomes significant, indicating that the RECBE boards may require radiation-hardened components or relocation.
Results: CyDet Electronics Room
The CyDet Electronics Room is a 1.5 × 1.5 × 3 m³ polyethylene box (10 cm wall thickness) mounted at the beam-exit end of the CyDet solenoid. It houses 45 G10 SimpleBoards arranged in three layers of three columns and five rows. Layer 0 is closest to the beamline, layer 2 furthest. The simulation geometry for this room was newly developed as part of this project.
Shield Radiation Dose
The polyethylene shield itself absorbs a large fraction of the incident radiation, protecting the boards inside. However, the dose is highly non-uniform: the face closest to the beamline (upper half, toward the CDC) receives two orders of magnitude more dose than the opposite face.
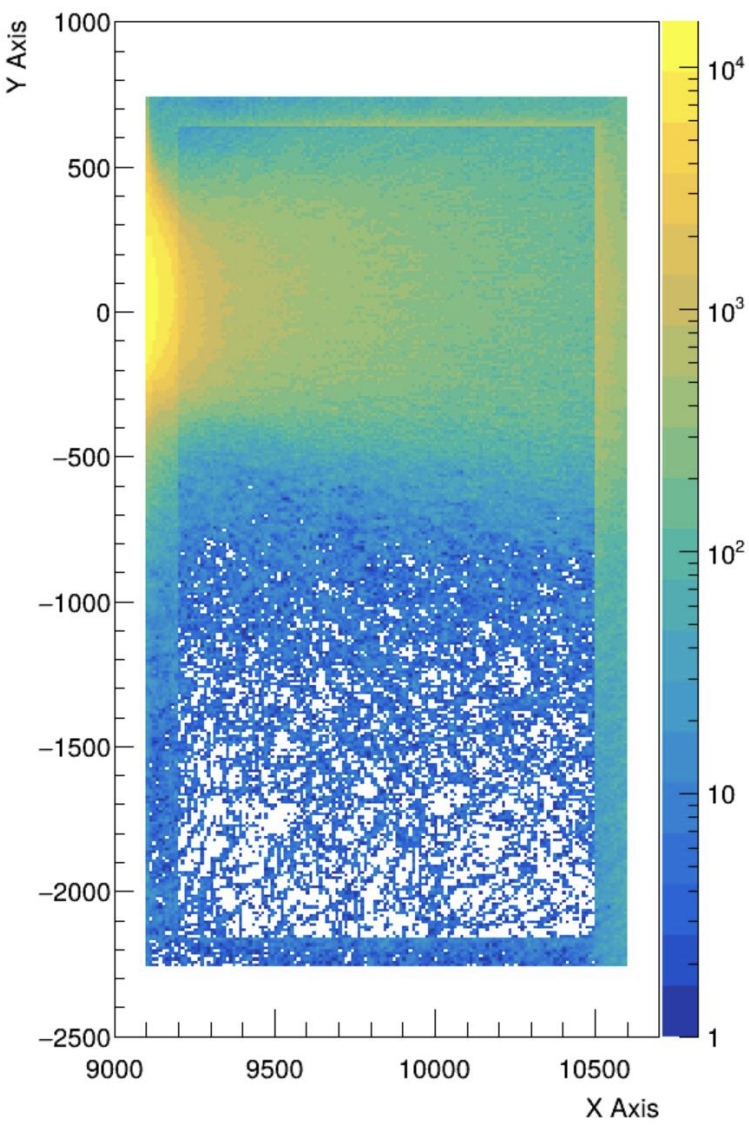
Shield dose (150 days): Overall average 233 Gy · Upper half (beam-facing) 457.7 ± 0.1 Gy · Lower half 8.37 ± 0.007 Gy. The strong asymmetry demonstrates that the shield is working as intended — but the beam-facing wall may itself need replacement or additional shielding over the experiment lifetime.
The neutron flux measured just inside the shield (InnerBox monitor) is 4.89×10¹⁰ ± 5×10⁸ per cm², reduced by roughly an order of magnitude compared to the unshielded RECBE boards, confirming the effectiveness of the polyethylene moderator.
SimpleBoard Radiation Dose
Inside the shield, the individual board doses span two orders of magnitude depending on position. Boards in layer 0 (closest to beam) and in the two top rows (highest y) receive by far the largest doses, consistent with the shield dose distribution.
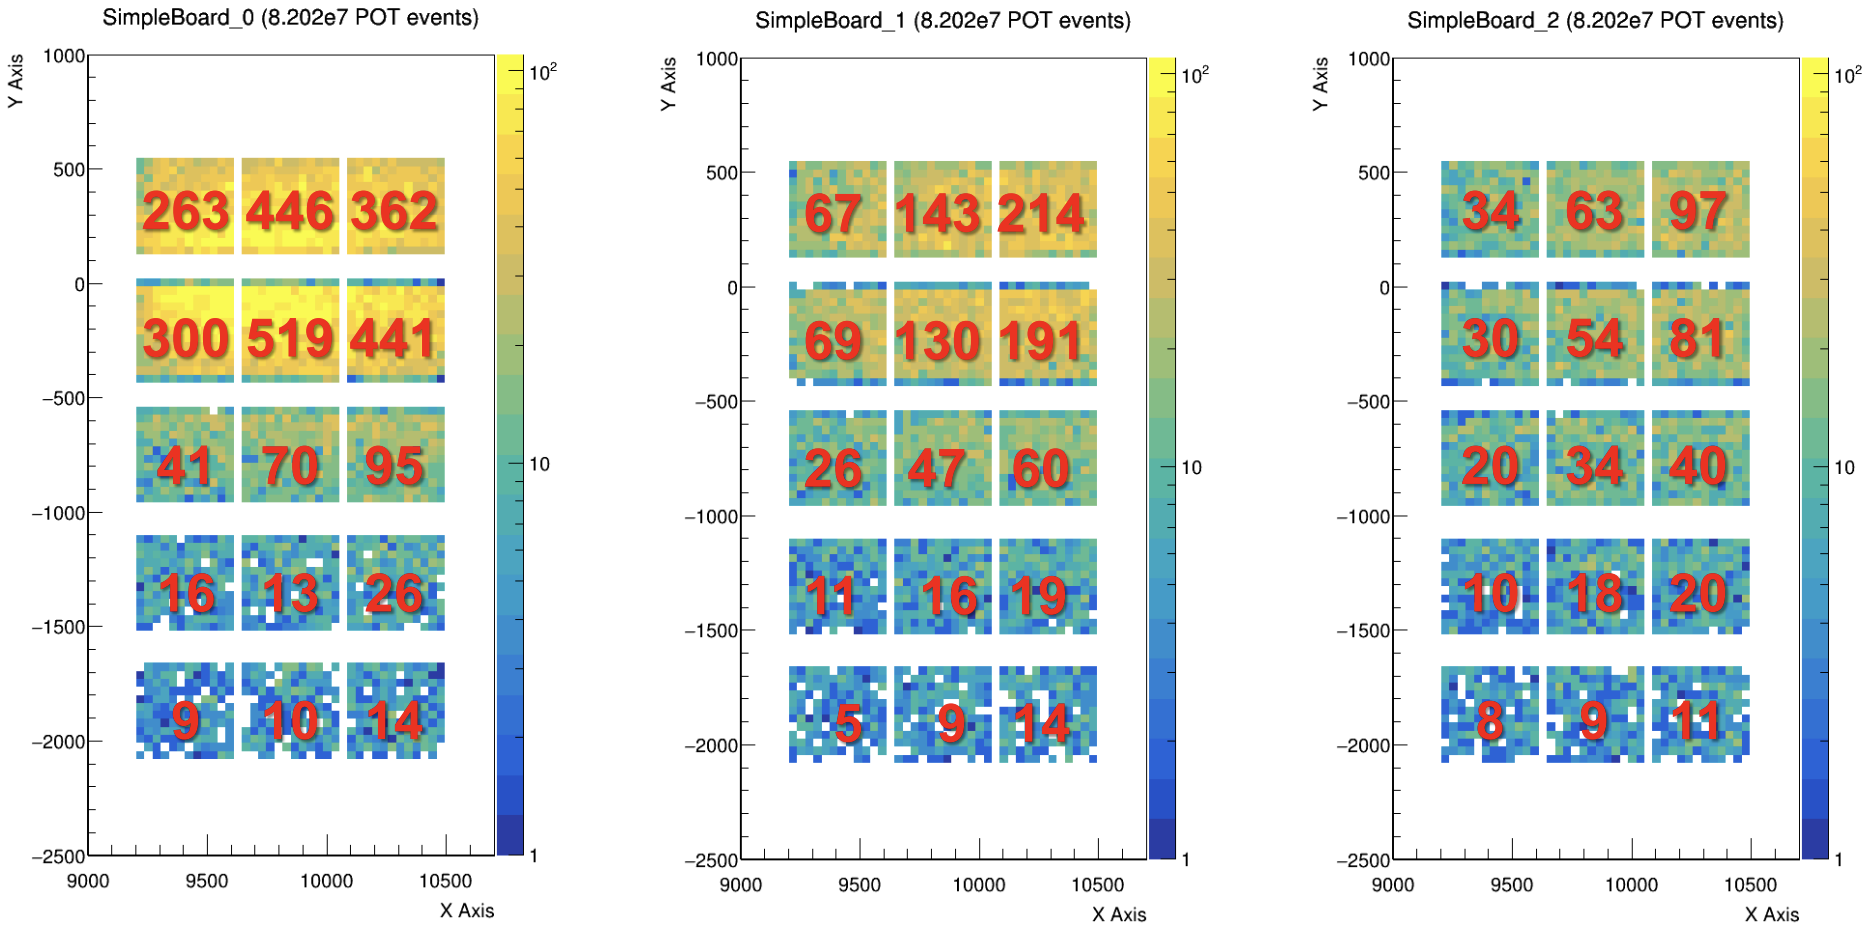
| Layer | Max dose (Gy) | Min dose (Gy) | Hottest board position |
|---|---|---|---|
| 0 (closest to beam) | 519 ± 5 | 8.9 ± 0.4 | Row 1, centre column |
| 1 | 214 ± 3 | 5.2 ± 0.2 | Row 0, right column |
| 2 (furthest from beam) | 97 ± 2 | 8.4 ± 0.3 | Row 0, right column |
Results: Electronics Hut
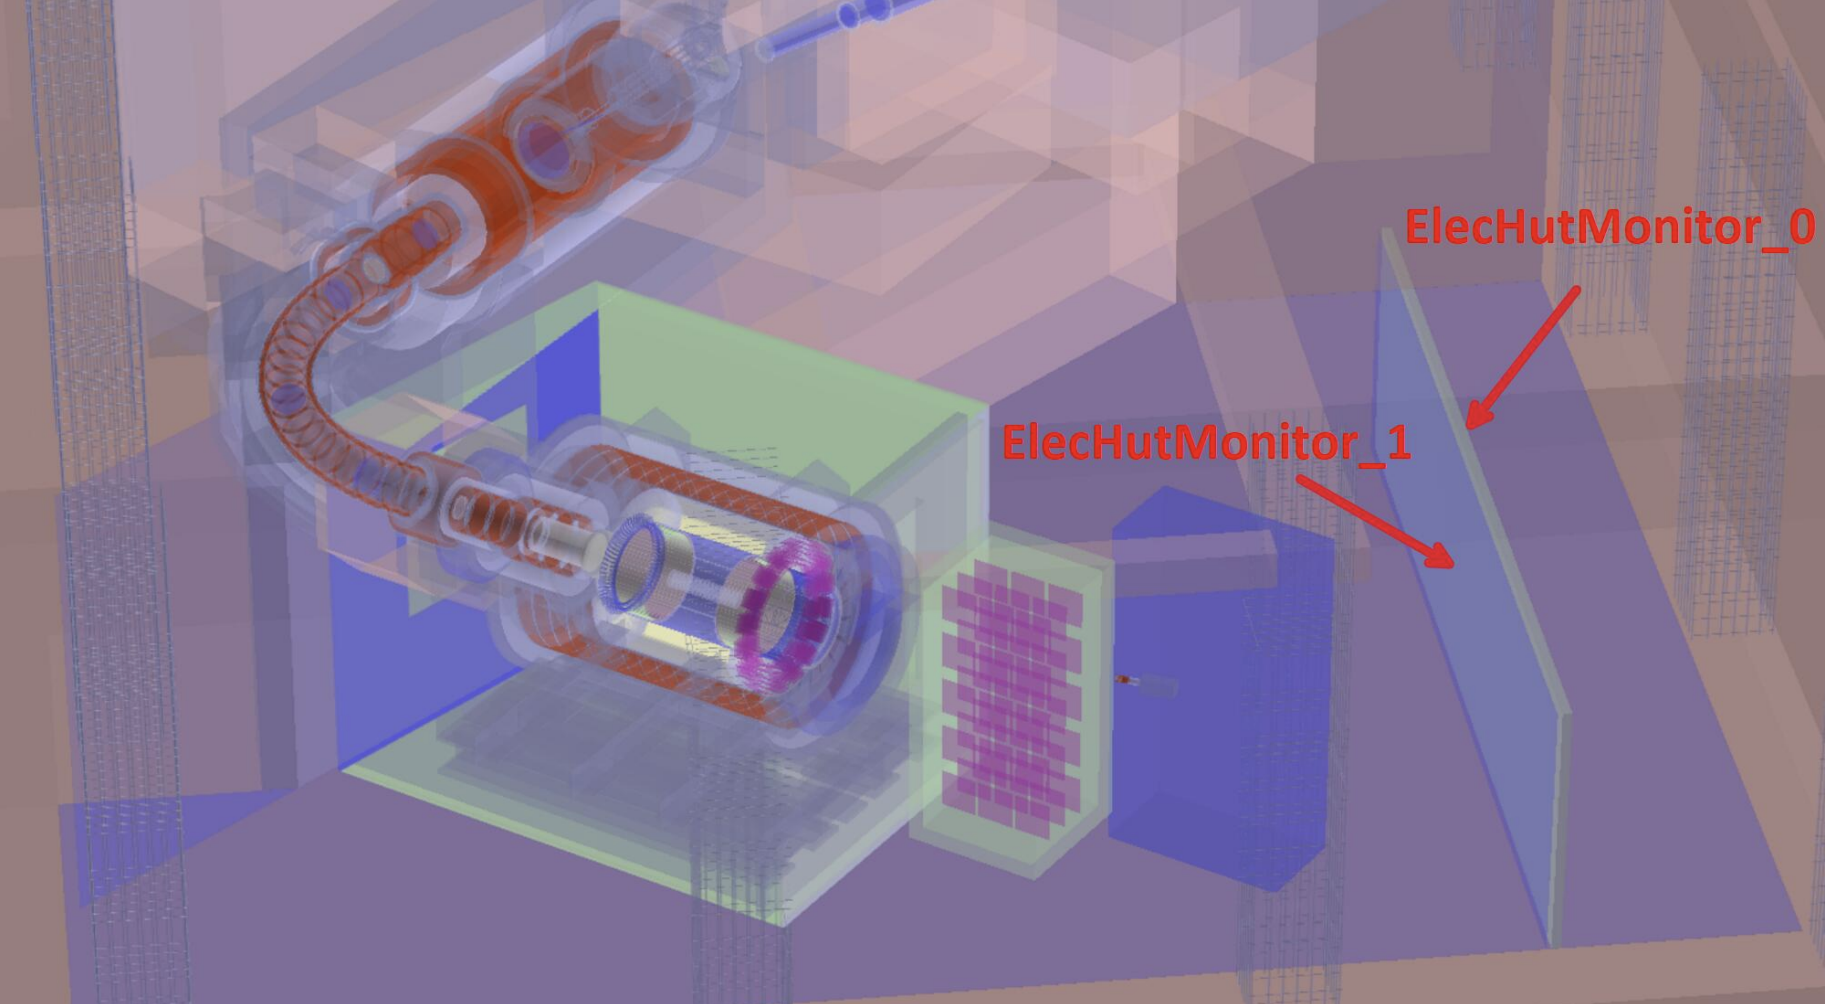
The Electronics Hut is situated at the far corner of the experiment hall, separated from the main detector by several metres of concrete shielding. It represents the remote counting room where most of the data acquisition electronics are housed. Although the dose and flux at this location are much lower than at the in-situ detectors, confirming the safety margin was a goal of the study.
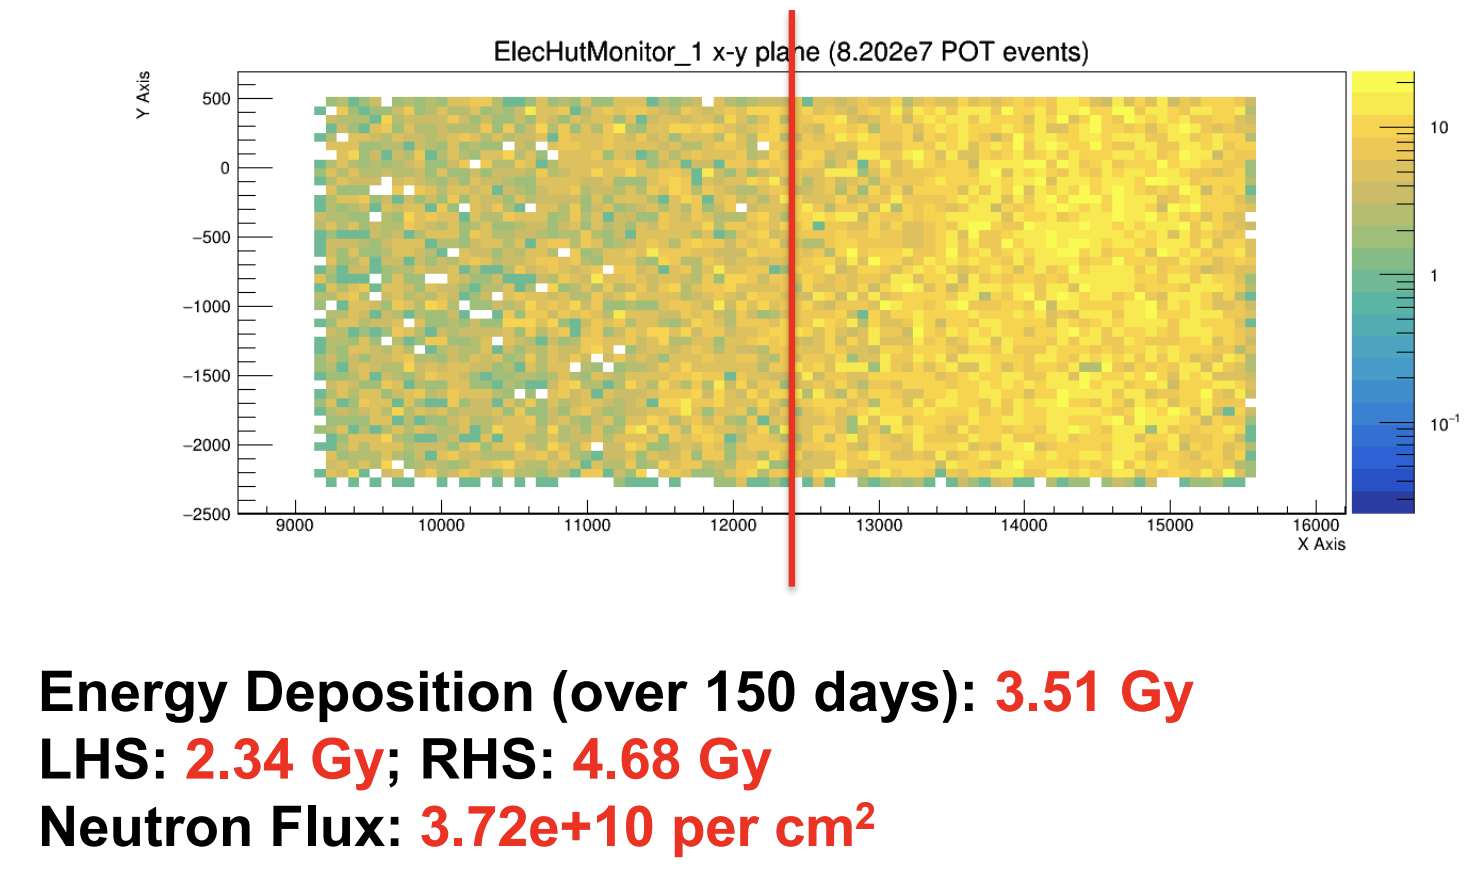
Electronics Hut (150 days): Radiation dose 3.51 ± 0.003 Gy (LHS 2.34 Gy, RHS 4.68 Gy) · Neutron flux 3.72×10¹⁰ per cm². At these levels, standard commercial electronics are safe for a full Phase-I run — the hut does not require additional shielding.
Summary
RECBE innermost layer requires attention: At 47 Gy and ~5×10¹¹ n/cm² over 150 days, layer 0 of the RECBE boards significantly exceeds typical TID thresholds for commercial components. Radiation-hardened alternatives or additional shielding between the CDC exit and the RECBE ring are recommended.
CyDet Electronics Room shield is effective but asymmetric: The polyethylene shield attenuates the neutron flux by ~10× inside the room, but its beam-facing half absorbs 457 Gy — more than 55 times the dose on the far side. The high-dose face may need periodic replacement or additional localised shielding.
SimpleBoard hotspot reaches 519 Gy: The highest-dose board in layer 0 receives over 500 Gy over 150 days. Boards should be placed as far from the beamline as geometry permits, or the two top rows of layer 0 should be filled with radiation-hard components only.
CTH and Electronics Hut are within tolerance: The CTH scintillators (14–26 Gy) and Electronics Hut (3.5 Gy) operate well within radiation-tolerance bounds of their respective materials, and require no additional shielding measures for Phase-I.
This technical note was delivered as a reference for COMET Phase-I hardware development. All simulation outputs and analysis macros are archived on the KEKcc cluster. Because of the short project duration (~8 weeks), the results carry caveats on systematic accuracy — nevertheless, the order-of-magnitude spatial gradients identified here are robust and provide clear engineering guidance on where to focus radiation-hardening effort before the experiment commences operation.
All Research