Specialisation Project (TSM) · 2025
Dark Count Rate and Time Resolution Measurements of SiPMs
Overview
Silicon Photomultipliers (SiPMs) are the photodetectors of choice in LHCb's Scintillating Fibre (SciFi) tracker. Their performance depends critically on two figures of merit: how quickly they resolve single-photon arrival times (the Single Photon Time Resolution, SPTR), and how often they fire spontaneously without any real photon (the Dark Count Rate, DCR). Both degrade with radiation exposure, making their precise characterisation essential for the LHCb Upgrade II program targeting 3×10¹² neq/cm² neutron fluence.
This project comprised two back-to-back experimental studies. In Part I, I characterised the SPTR of a 42 µm single-cell FBK SiPM under a sweep of laser intensities, identifying the optimum illumination regime and quantifying the laser's own timing uncertainty. In Part II, I measured the DCR of neutron-irradiated SiPMs (1×10¹³ neq/cm²) at cryogenic temperatures down to 100 K inside a cryostat, using Poisson statistics to separate true dark counts from correlated noise. The best time resolution achieved was 35 ps FWHM (≈15 ps σ), and the DCR measurements revealed a competition between afterpulsing and pixel recovery effects that produces non-Poissonian count distributions.
Background: SiPM Operation
A SiPM is an array of Single-Photon Avalanche Diodes (SPADs), each operated above its breakdown voltage Vbd — the so-called Geiger mode. An incident photon (or thermally generated carrier) triggers a self-sustaining avalanche. A quenching resistor drops the bias below Vbd, stopping the avalanche and allowing the microcell to recharge. The SiPM output is the analogue sum of all fired cells, making the signal approximately proportional to the number of detected photons up to the cell-saturation limit.
Single Photon Time Resolution (SPTR)
The SPTR quantifies the spread in timing between a photon's arrival and the SiPM's electrical response. Five independent contributions add in quadrature:
- Intrinsic error — non-uniform electric field inside each SPAD causes position-dependent avalanche initiation times.
- Transit time skew — cells at different distances from the readout node have different signal propagation delays (absent for single-cell SiPMs).
- Electronic jitter — baseline noise causes uncertainty in the threshold-crossing time; estimated as FWHMjitter = 2.3458 × σnoise / (dV/dt).
- Trigger time error — the laser synchronisation output carries <20 ps uncertainty.
- Laser uncertainty — the laser pulse itself has a temporal spread (~56 ps FWHM per the manufacturer's datasheet for the PicoQuant LDH-D-C-450 head).
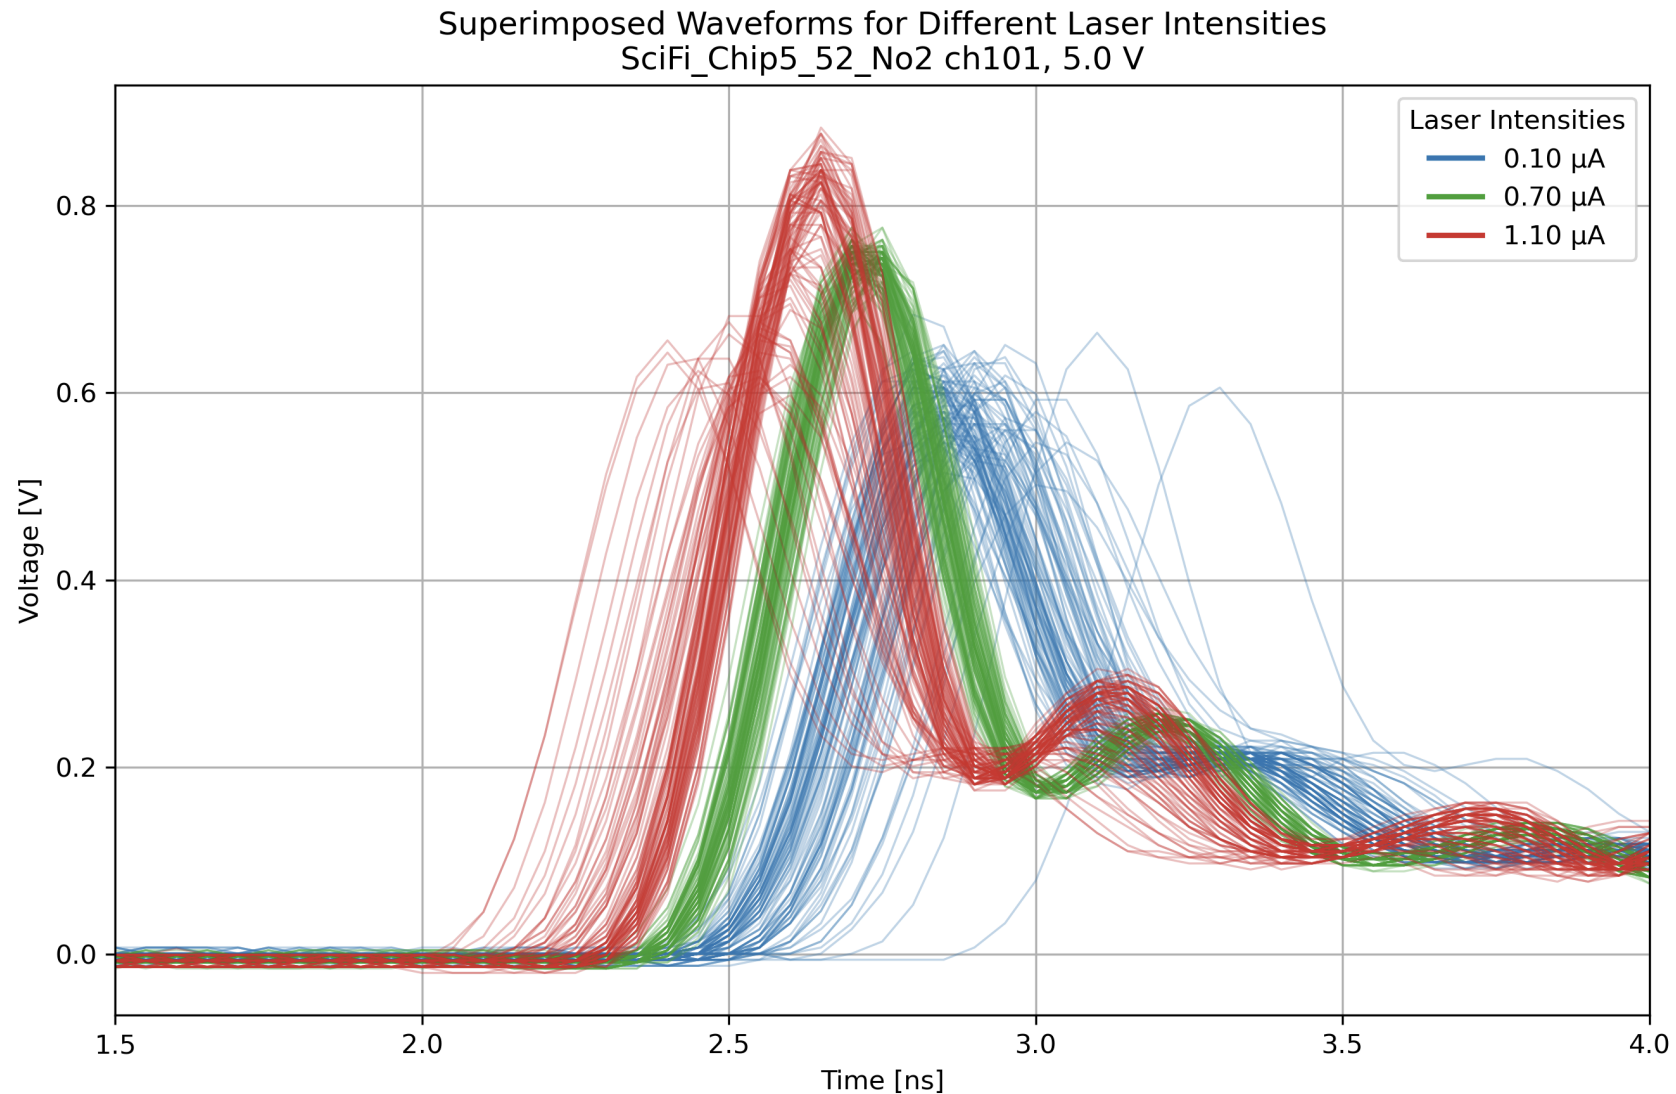
By increasing the laser intensity, the SiPM always triggers on the earliest photons in the pulse distribution (the leading edge), effectively suppressing the laser's own timing contribution and enabling a purer measurement of the SiPM's intrinsic SPTR.
Dark Count Rate (DCR)
DCR arises from thermally generated carriers inside the silicon lattice triggering spurious avalanches. It depends exponentially on temperature: DCR ∝ exp(−Ea/kT), where Ea is the activation energy for carrier generation. Neutron irradiation creates lattice defects that act as trap-assisted tunnelling (TAT) centres, dramatically increasing DCR. Cooling to ≈100 K can suppress the DCR by up to five orders of magnitude relative to room temperature.
Two secondary noise sources deviate the inter-event time distribution from the ideal Poisson exponential: afterpulsing (trap-released charges retriggering the same cell after a delay, creating an excess of short inter-event times) and recovery-time suppression (a recently fired cell cannot avalanche again until recharged, creating a deficit at short intervals when the count rate is high).
Devices Under Study
Part I — Single-cell SiPM for SPTR (FBK Wafer 1)
| Device | Cell Size | Feature | Overvoltage Scanned |
|---|---|---|---|
| FBK W1 — SciFi Chip5_52_No2 | 42 µm | Full metal layer, single-cell | 2.0 – 9.0 V (0.5 V steps) |
The single-cell geometry eliminates transit time skew (all avalanches read out at the same distance) and crosstalk, making it ideal for isolating intrinsic SPTR contributions. Only the cell with the full metal layer is used.
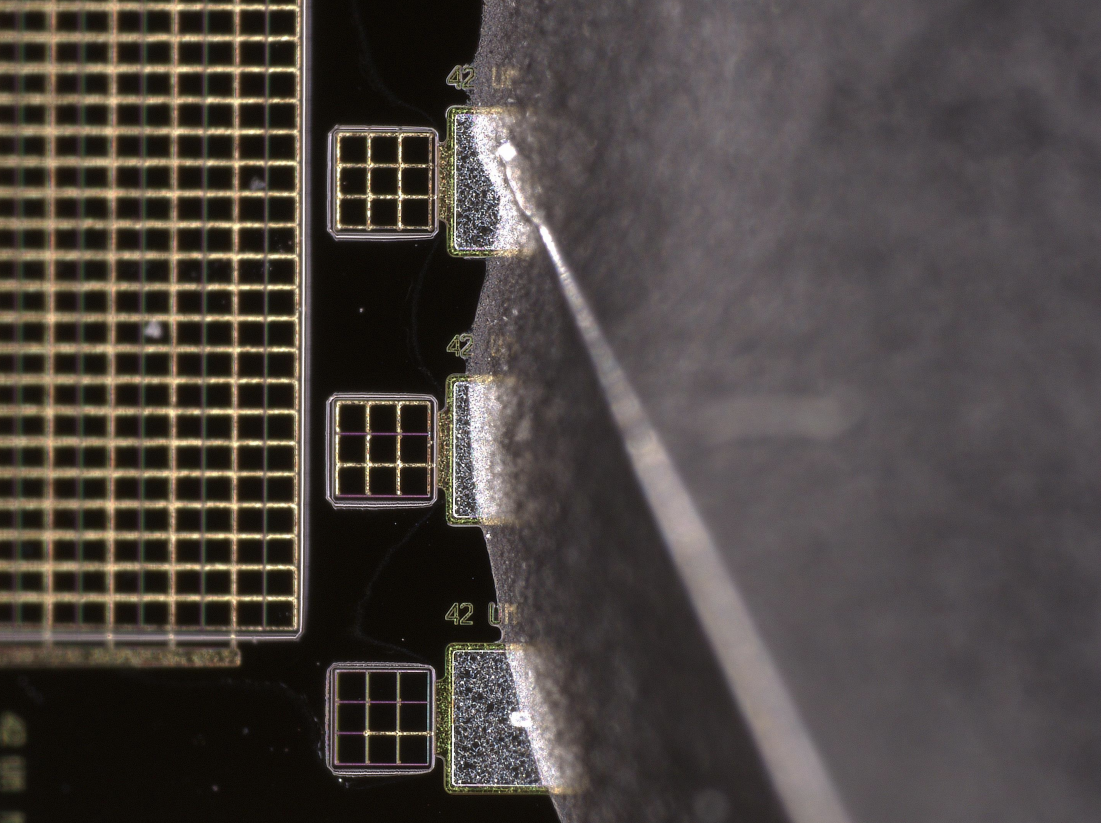
Part II — Neutron-irradiated SiPMs for DCR (FBK 2022)
| Device | Cell Size | Fluence (neq/cm²) | Temperature |
|---|---|---|---|
| FBK NUV-HD-MT (C3) | 42 µm | 1×10¹³ | 100 K |
| FBK NUV-HD-MT (C1) | 31 µm | 1×10¹³ | 100 K |
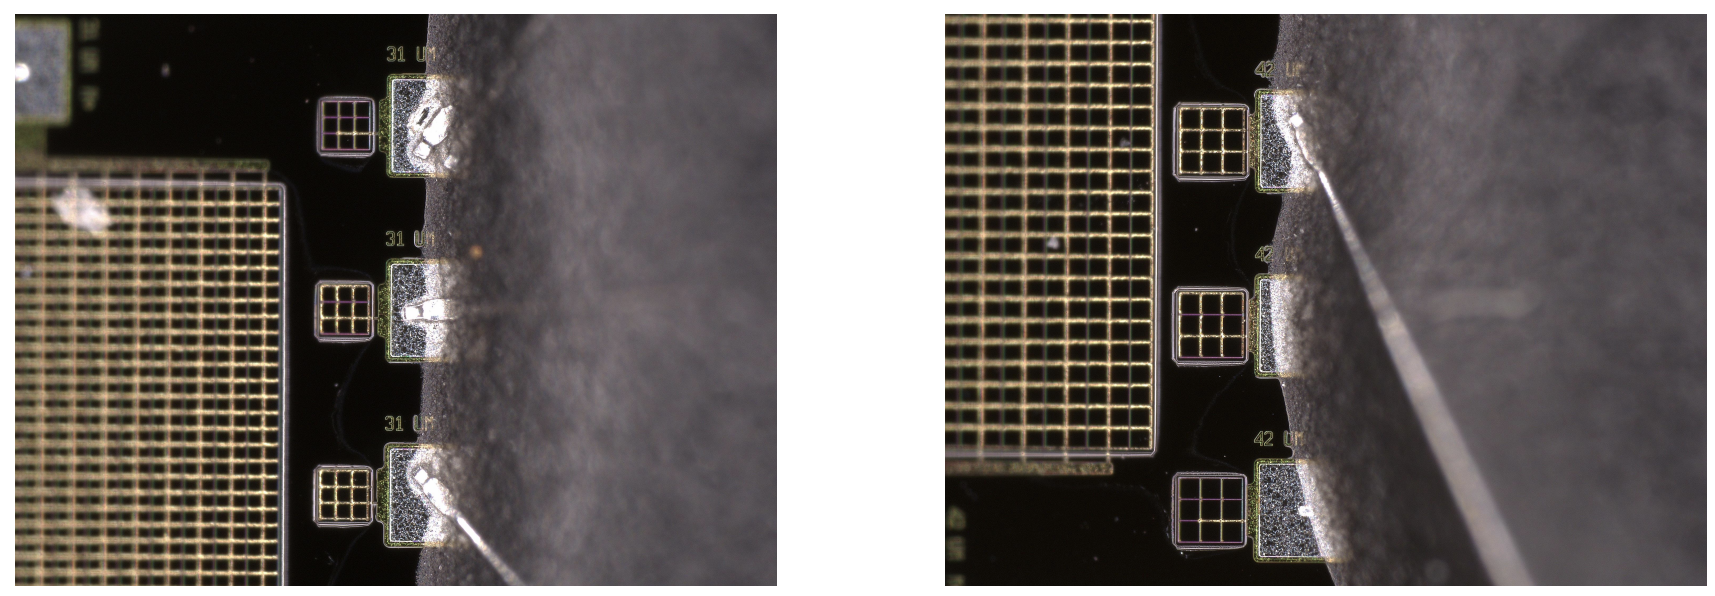
Single-pixel SiPMs were used to eliminate optical crosstalk, allowing afterpulsing and recovery-time effects to be studied in isolation. Both cell sizes were measured in dark (no illumination) and under weak laser illumination to probe the DCR at low overvoltages where dark counts alone are too few to trigger the oscilloscope reliably. Thermal annealing of 2 weeks at 30°C was performed after irradiation before measurements began.
Part I: Single Photon Time Resolution
Experimental Setup
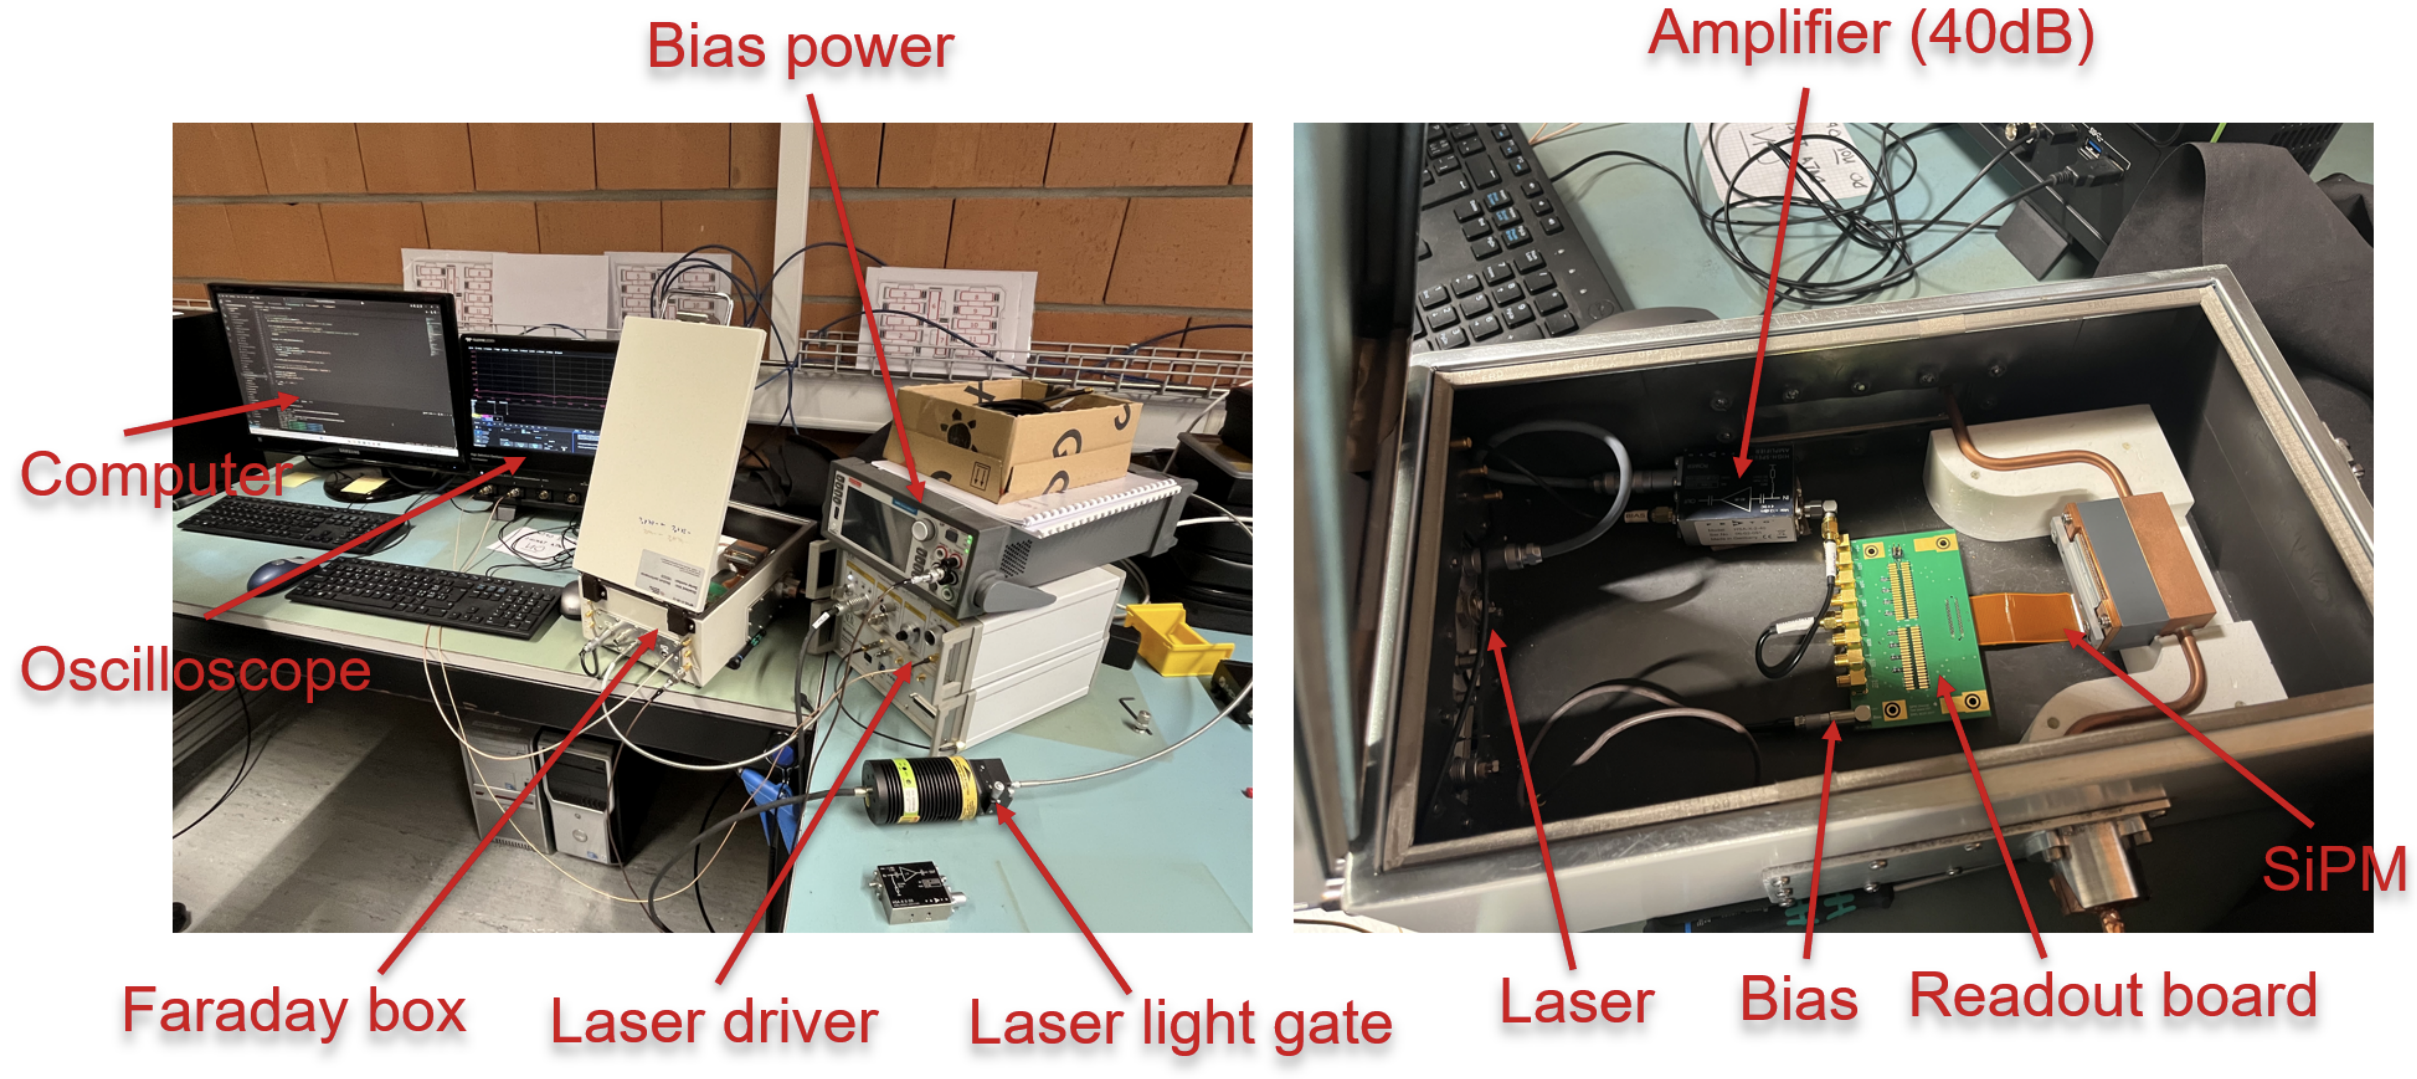
The SiPM is placed inside a shielded Faraday box to suppress electromagnetic interference and block ambient light. A PicoQuant pulsed laser (454 nm, 40 MHz repetition rate, 56 ps FWHM) illuminates the SiPM through an adjustable aperture. The output is amplified by 40 dB before digitisation on a Teledyne LeCroy HD 4096 oscilloscope (12-bit, 500 ps/div). The oscilloscope is triggered on the laser synchronisation output; 50 000 waveforms are collected per voltage point.
Laser intensity is controlled by adjusting the aperture knob. Rather than relying on aperture position (which is nonlinearly correlated with optical power), the SiPM bias current at a fixed 35 V bias is used as a proxy for relative intensity.
Analysis Method
For each laser intensity and overvoltage setting, a two-stage filter is applied to the 50 000 waveforms to isolate single-photon events:
- Baseline filter — applied to the waveform region before the signal time window. Events with anomalously large pre-signal amplitudes (superimposed dark-count residuals) are rejected.
- Amplitude filter within the time window — events are binned by their peak amplitude into background, single-photon, and multi-photon categories. Only the single-photon band is retained for timing analysis.
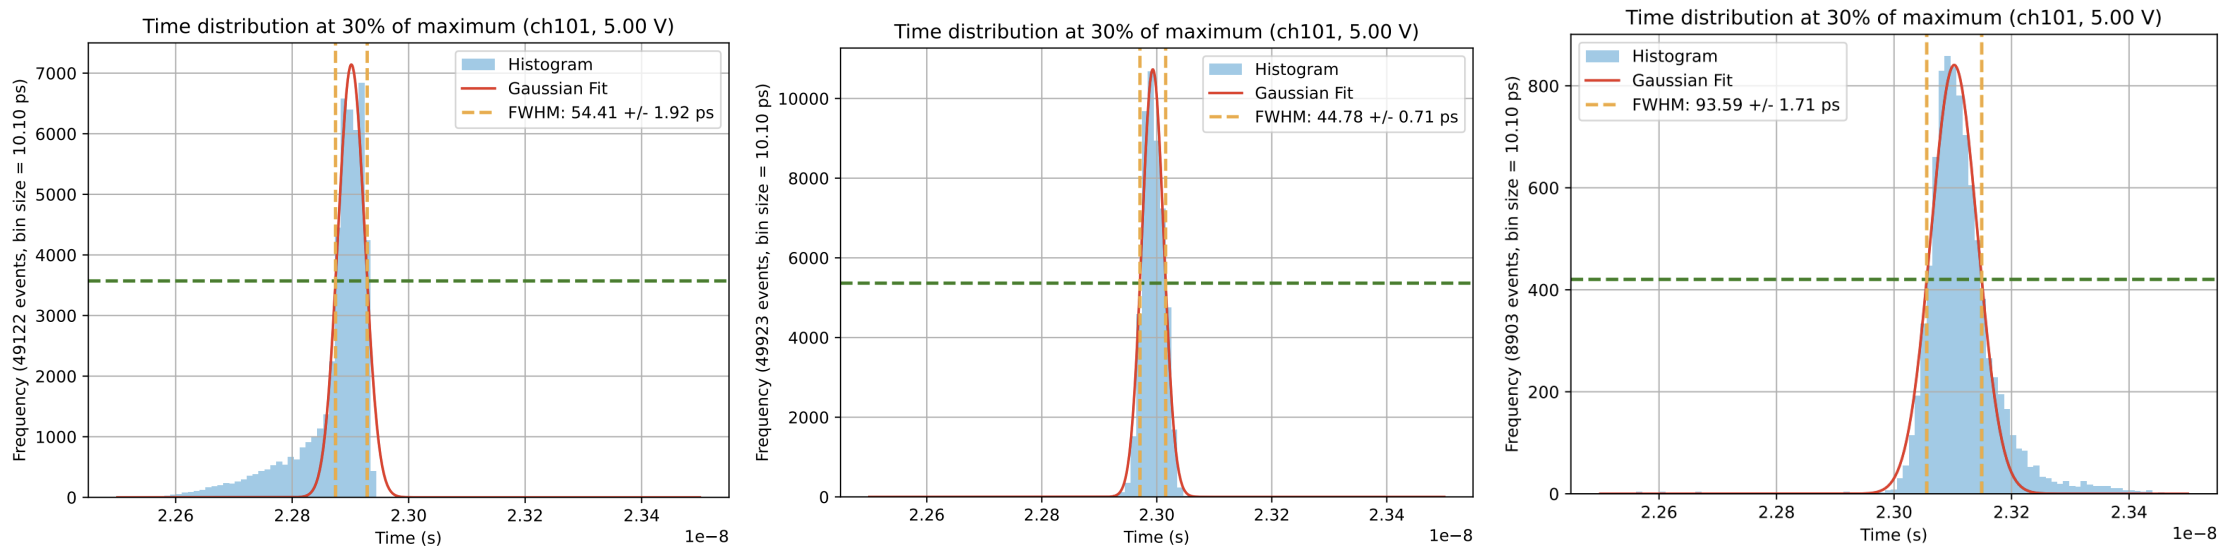
Key method: The arrival time of each waveform is extracted by finding the first threshold crossing at a given fraction of the peak amplitude, using linear interpolation between samples for sub-sample precision. FWHM is then obtained by fitting a Gaussian to the resulting time distribution.
For each overvoltage, the threshold fraction is scanned from 5% to 95% in 5% steps. The FWHM at each threshold is extracted, and the average of the three lowest FWHM values across the scan is used as the representative timing resolution for that overvoltage, reducing sensitivity to noise fluctuations at any single threshold.
Results
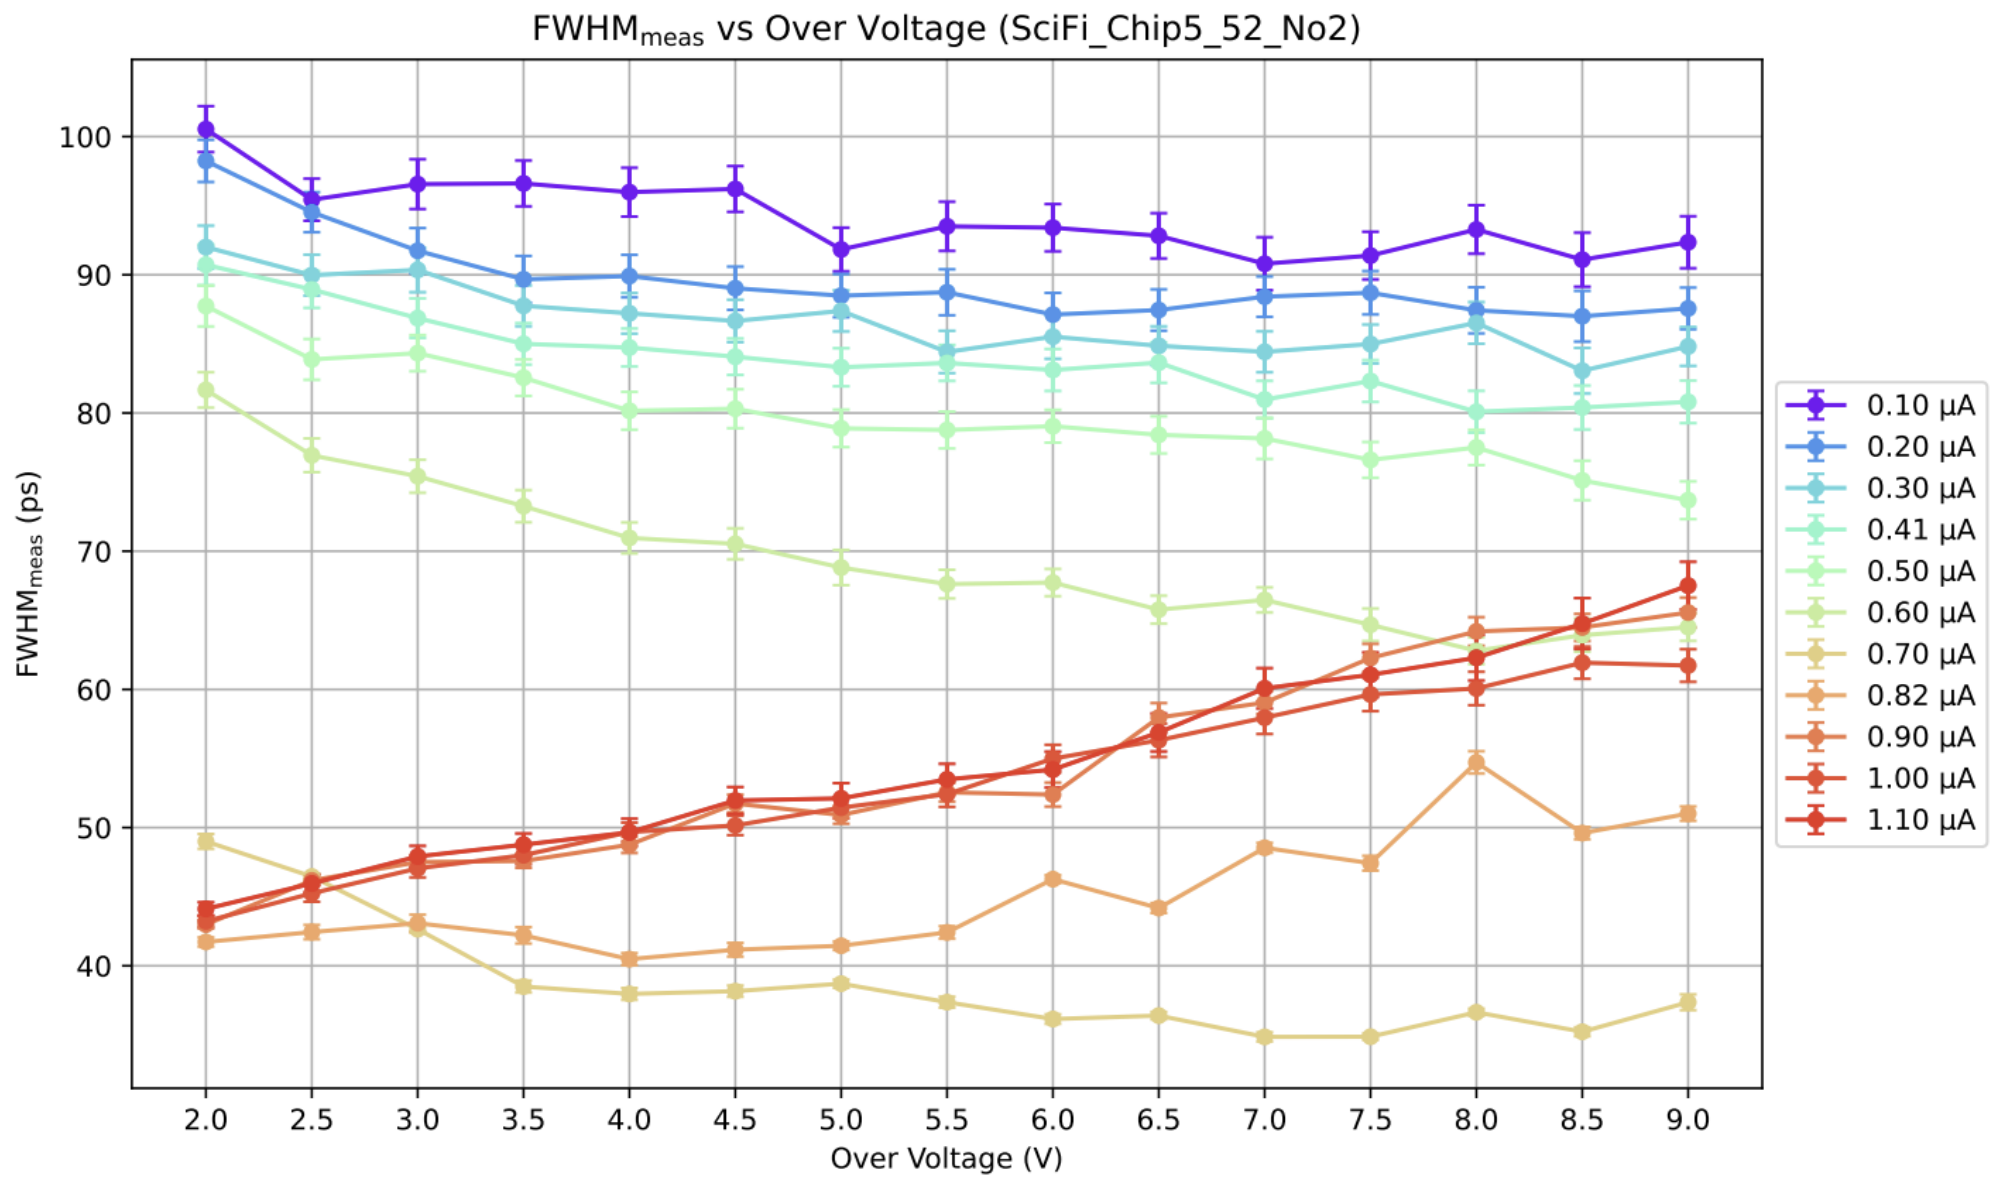
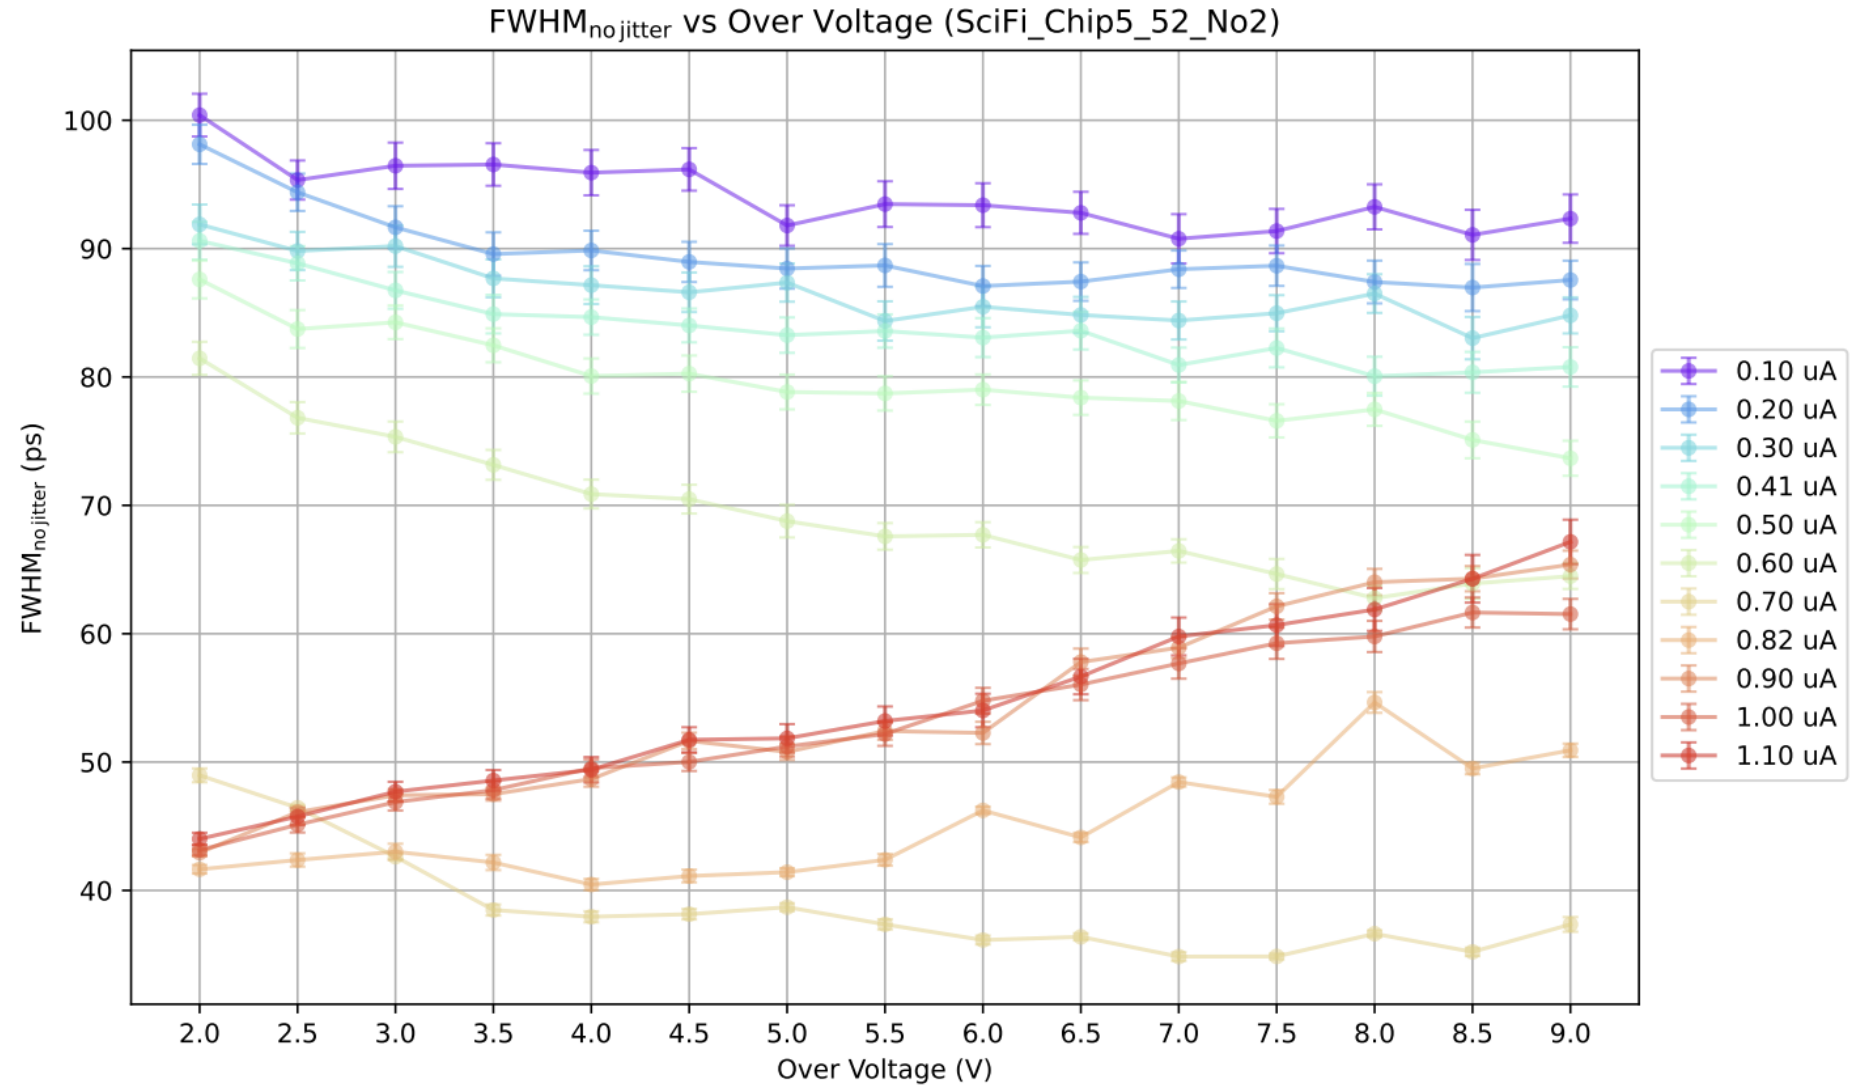
Best SPTR achieved: 35 ps FWHM (≈15 ps σ) at 0.70 µA laser intensity. Comparing the two extreme intensities, the laser timing uncertainty is estimated at ≈80 ps — notably larger than the 56 ps quoted by the manufacturer, suggesting possible optical path contributions (fibre internal reflections, alignment) or laser calibration drift.
Part II: Dark Count Rate at Cryogenic Temperatures
Experimental Setup
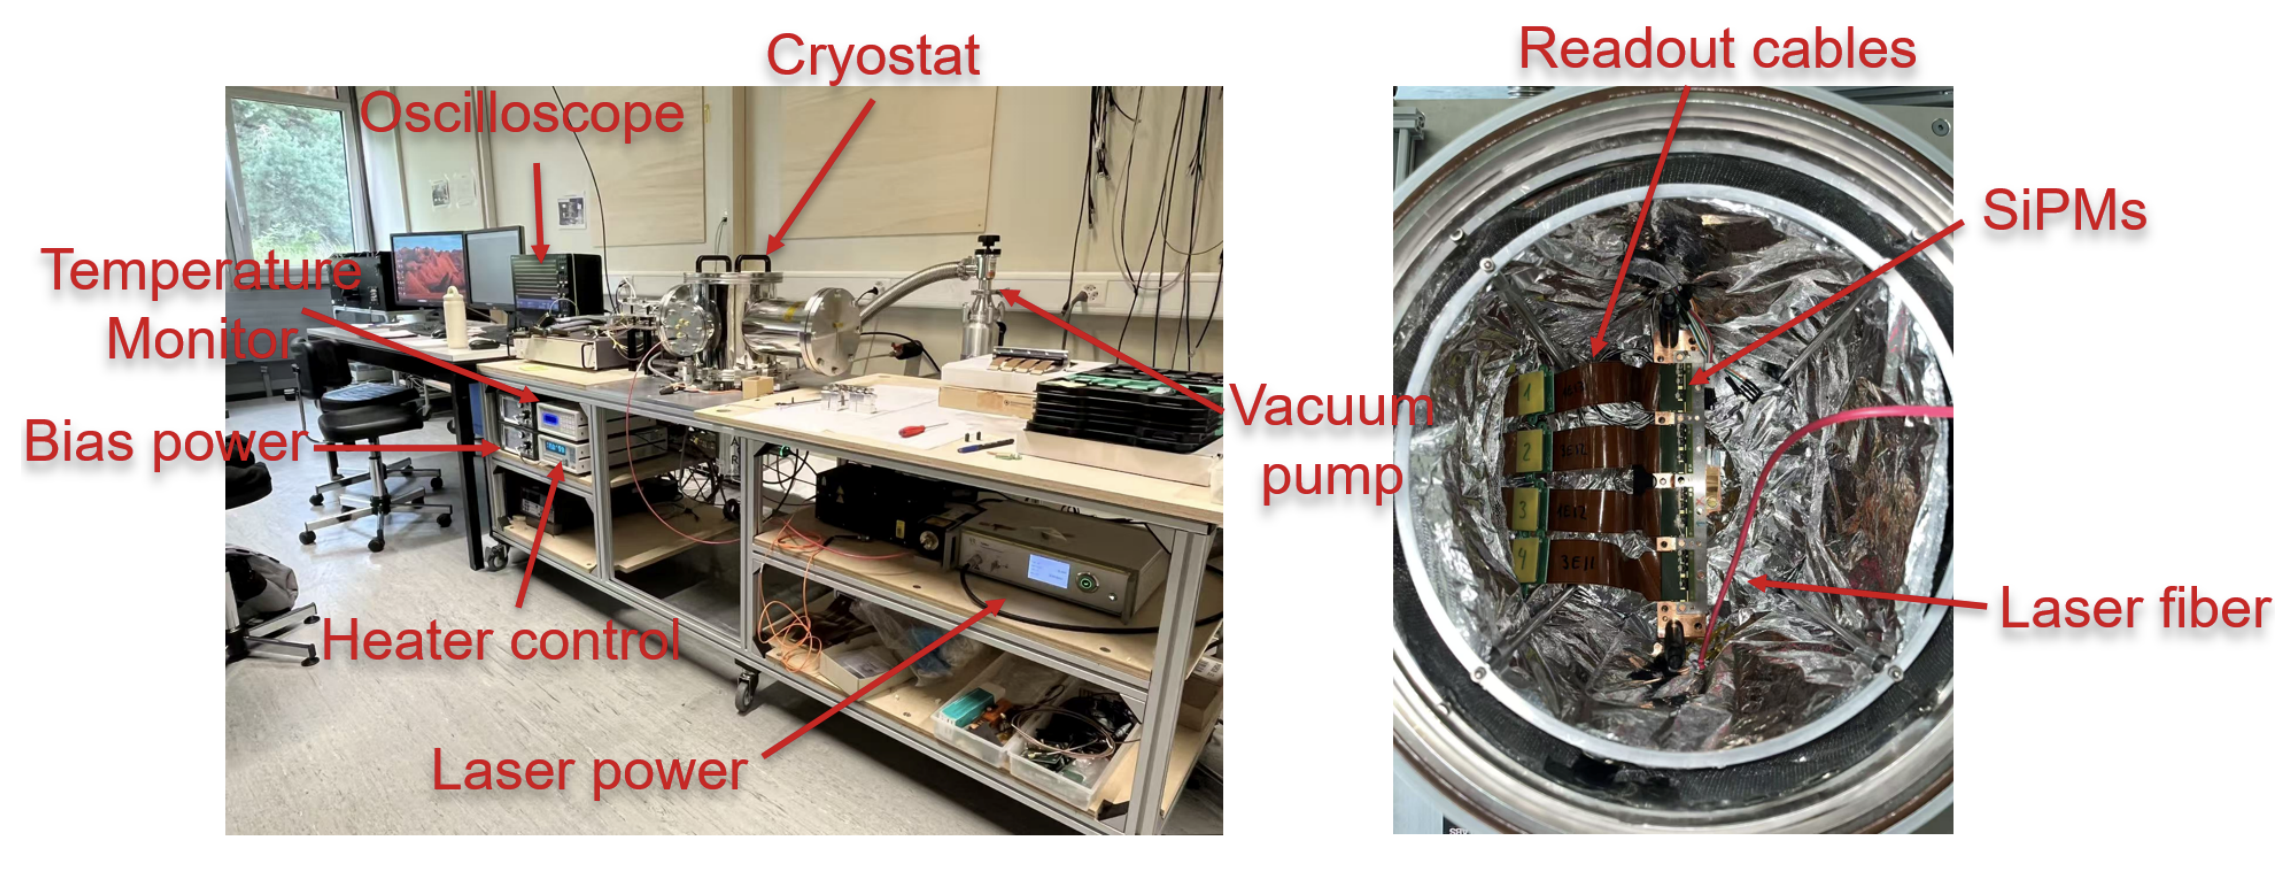
The irradiated SiPMs are mounted inside a vacuum cryostat. A roughing pump evacuates the chamber to suppress convective heat transfer, then a cryogenic cooling system brings the temperature down to 100 K. A temperature controller with a resistive heater allows fine-grained temperature stabilisation. A laser fibre provides optional weak illumination for measurements at low overvoltages where dark counts alone are insufficient to trigger reliably. A Teledyne LeCroy oscilloscope records 40 ms acquisition windows; all detected peaks are extracted by waveform peak-finding in Python (LecroyTRC reader + NumPy).
Breakdown Voltage Determination
The breakdown voltage Vbd at each temperature is extracted using the Inverse Logarithmic Derivative (ILD) method. The SiPM current is measured as a function of bias voltage under controlled laser illumination. The ILD is defined as:
ILD(V) = I · dV/dI = (1/(1+κ)) · (V − Vbd)
Because the ILD is linear in voltage above breakdown and equals zero exactly at Vbd, the breakdown voltage is obtained by extrapolating the linear region to the voltage axis. This is more robust than simple threshold-crossing methods, particularly at cryogenic temperatures where the I–V curve can be distorted by carrier freeze-out.
Analysis Method: Poisson Fitting
For an ideal noise-free SiPM, dark counts obey a Poisson process: the time intervals between successive events follow an exponential distribution P(t) = R · e−Rt, where R is the DCR. Each 40 ms waveform is processed to extract the amplitude and time separation of all peaks above a noise threshold. A 2D histogram of amplitude vs. inter-event time is used to visually separate three regimes:
- Electrical noise — low amplitude, uniformly distributed in time.
- Recovery-time region — very short inter-event times (<1 µs) where cells are only partially recharged after a previous avalanche, producing reduced-amplitude pulses.
- Dark counts — full-amplitude events at longer inter-event separations following the Poisson exponential.
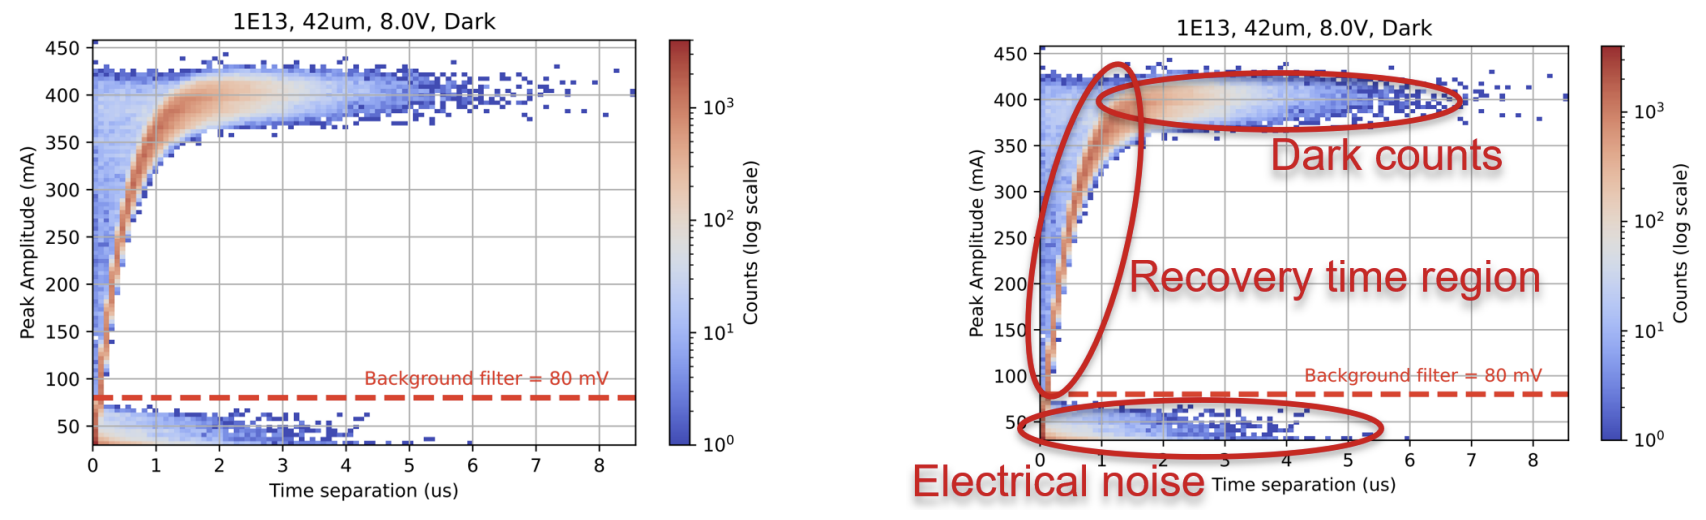
Fitting strategy: After amplitude-filtering to remove the noise floor, the time-separation histogram is fit with an exponential in the Poisson region (typically 3–20 µs for dark conditions, 1–5 µs for illuminated conditions). The fitted decay constant gives the DCR directly. The non-Poisson region at short times is excluded from the fit range.
Results
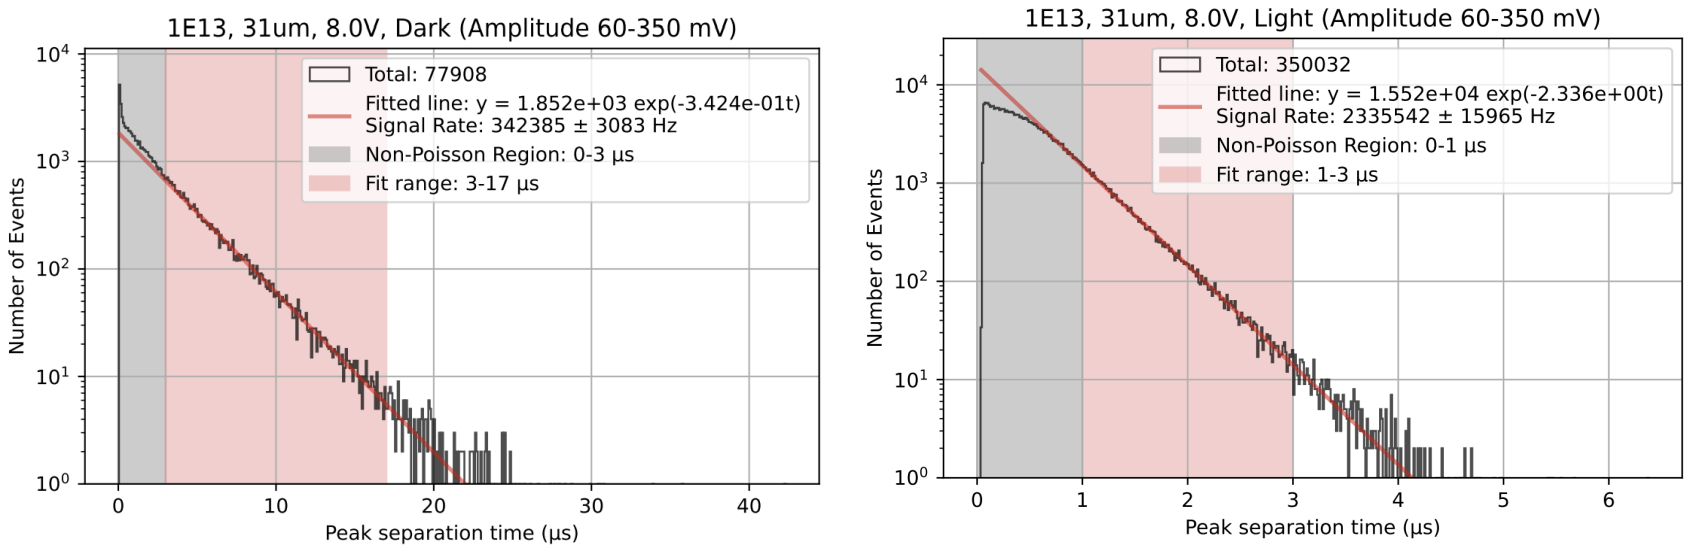
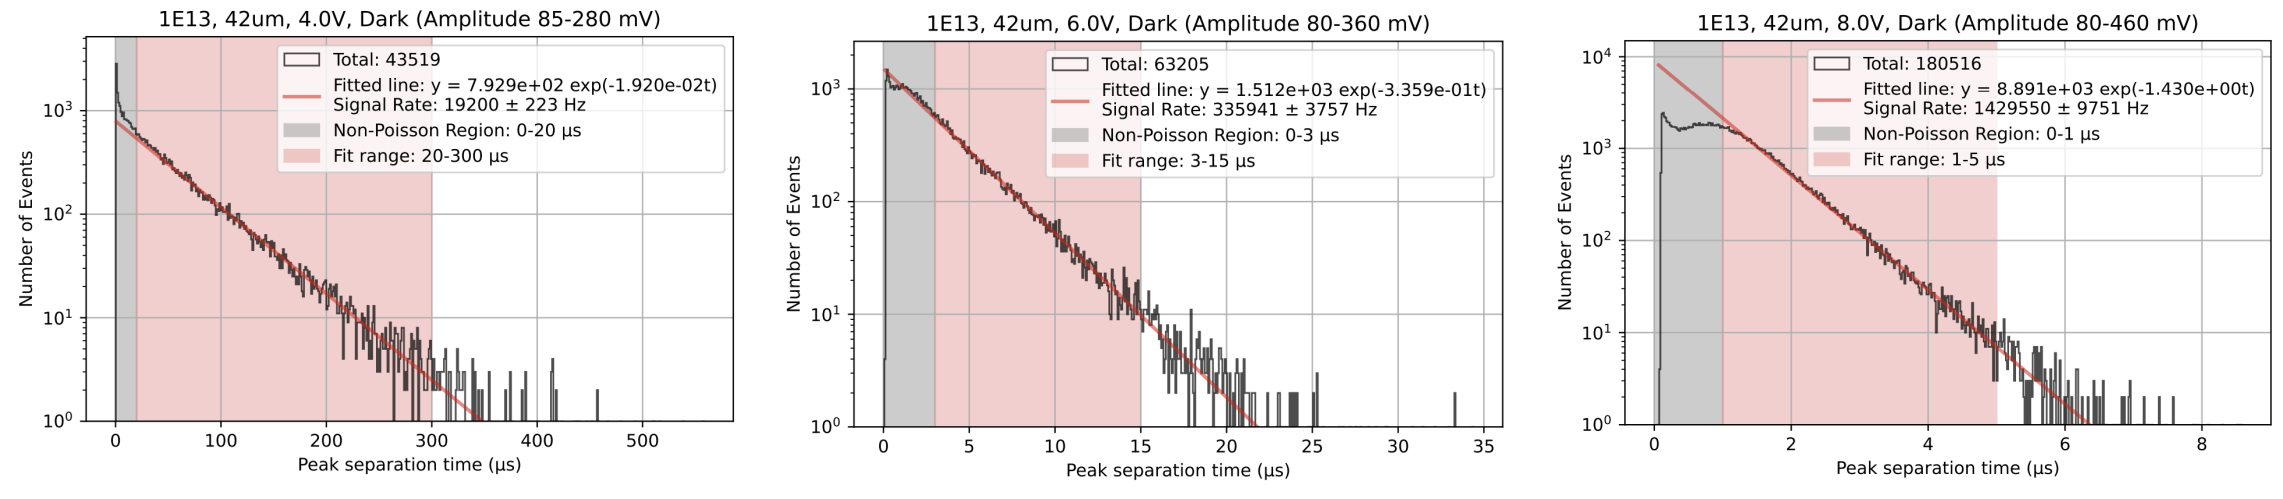
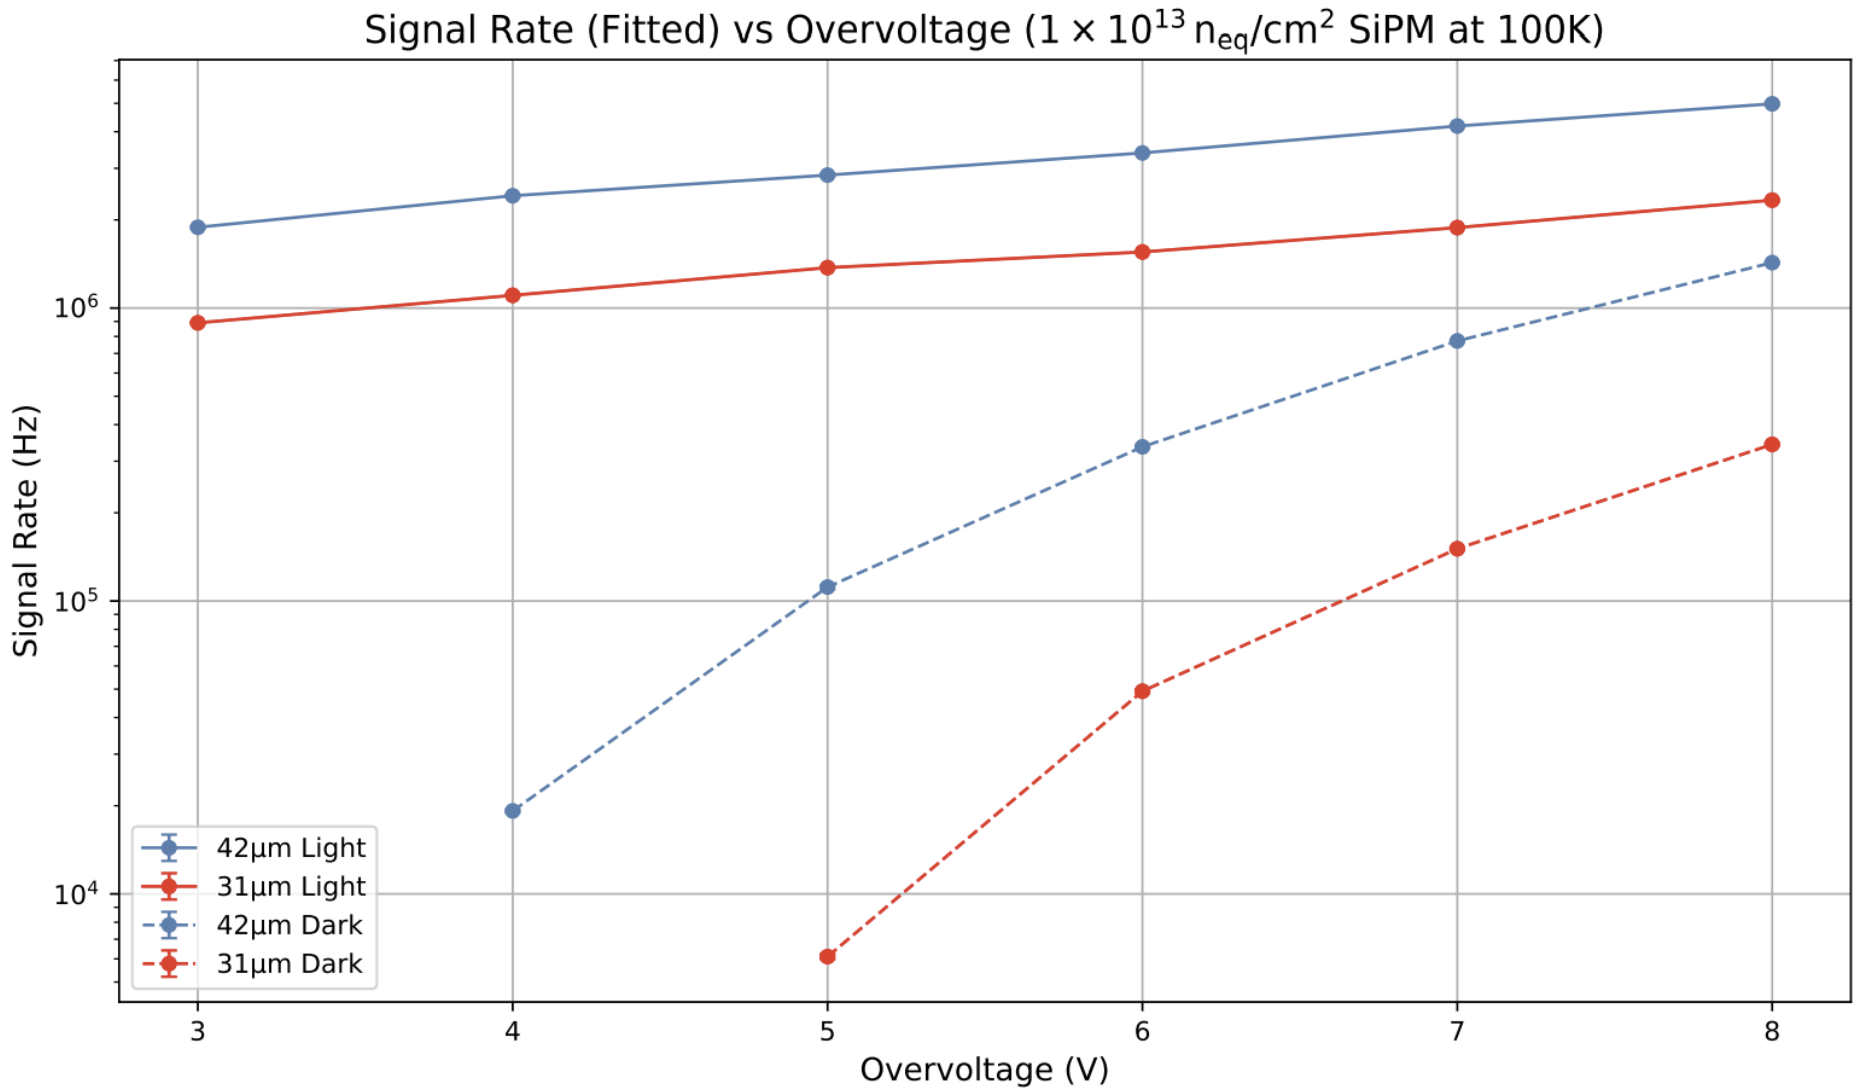
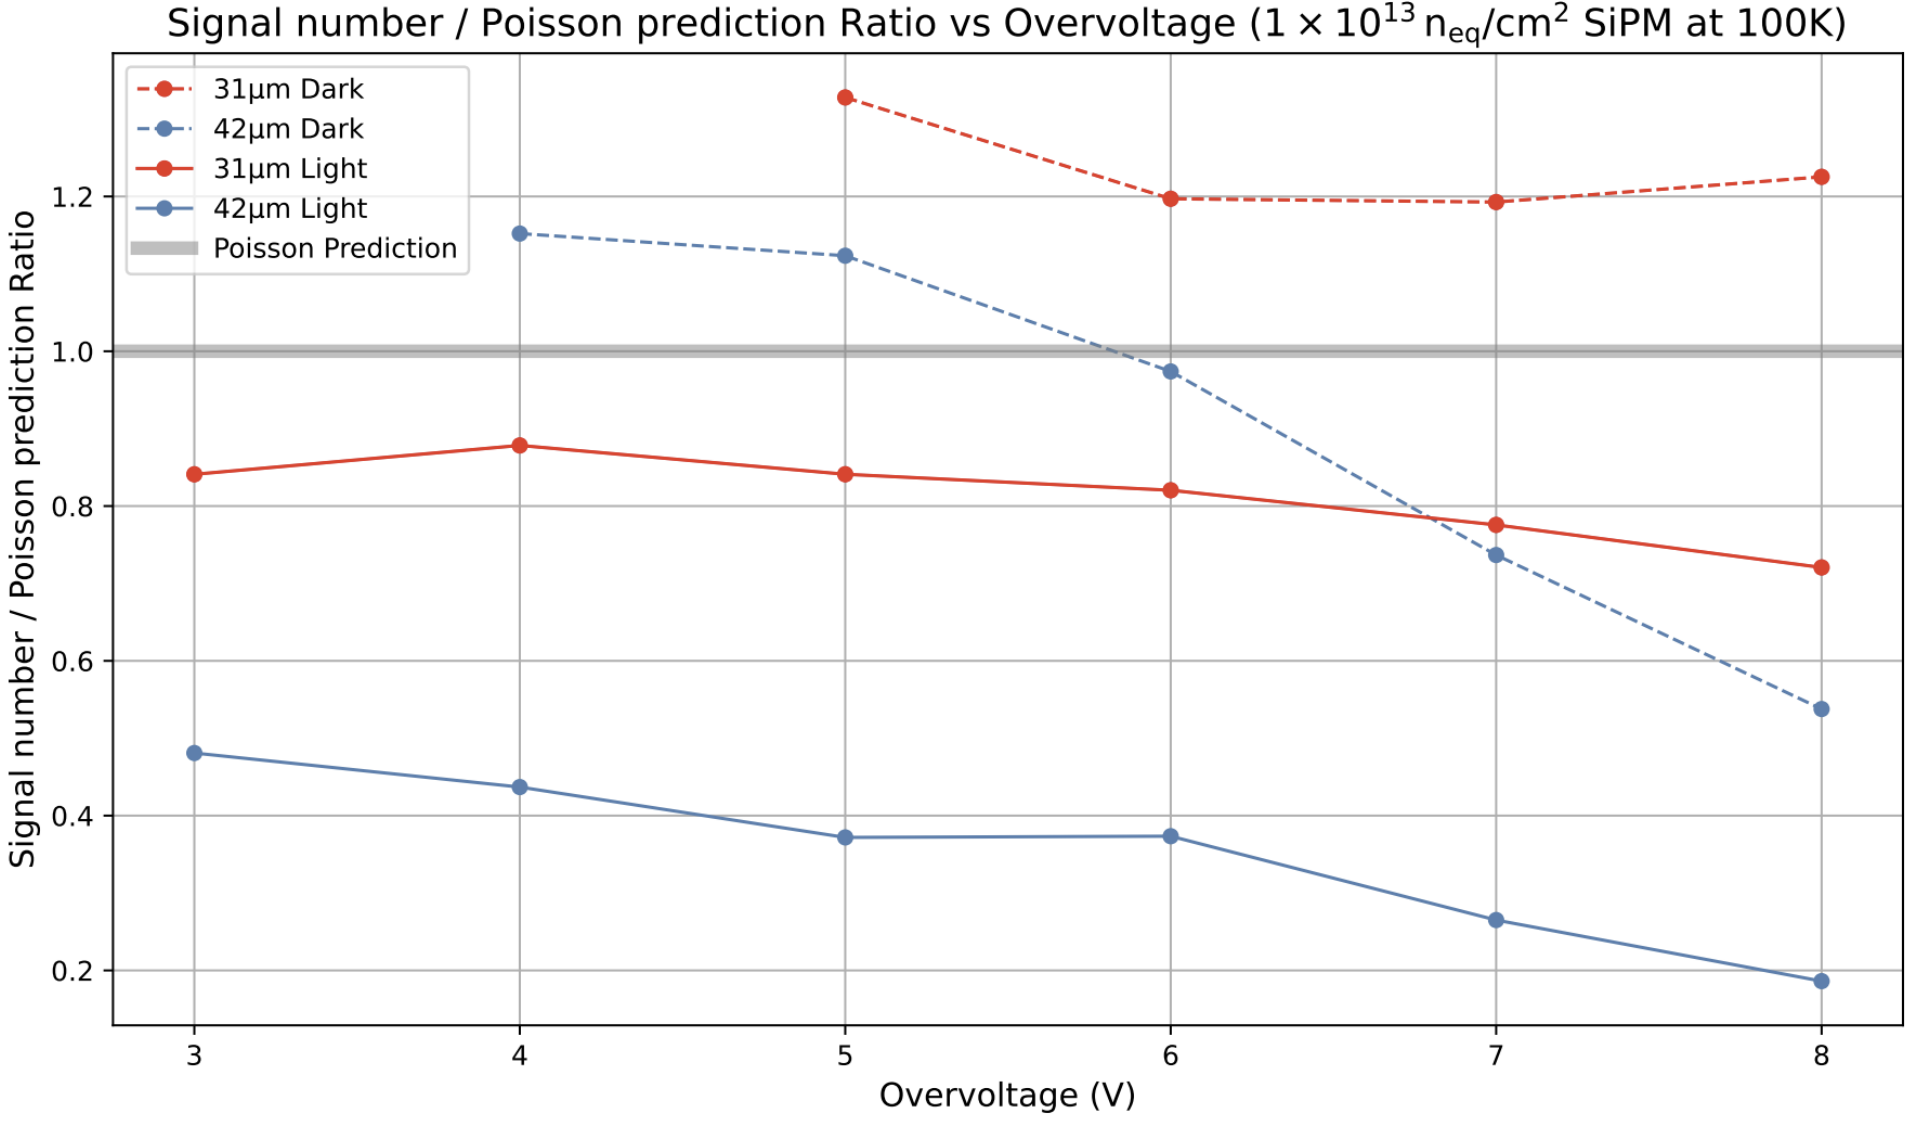
DCR results at 100 K, 1×10¹³ neq/cm²: At 8.0 V overvoltage, the 42 µm cell reaches ≈1.43 MHz (dark) and ≈4.88 MHz (illuminated); the 31 µm cell reaches ≈343 kHz (dark) and ≈2.34 MHz (illuminated). Both scale as expected with pixel area (42² / 31² ≈ 1.84).
Afterpulsing ↔ recovery-time transition: For the 42 µm SiPM, the dominant correlated-noise mechanism shifts from afterpulsing (excess at short times) to recovery-time suppression (deficit) at ≈6 V overvoltage, where the DCR rises above ≈300 kHz. This transition arises because at higher rates the mean inter-event spacing approaches the pixel recharge time constant τrec = RqCcell.
Summary
SPTR of 35 ps FWHM achieved at 0.70 µA laser intensity — equivalent to σ ≈ 15 ps, or ~5 mm spatial resolution for relativistic particles. The optimal intensity is set by the balance between laser timing suppression (favouring higher intensity) and amplitude saturation effects (favouring lower intensity).
Laser uncertainty ≈ 80 ps inferred from the difference between SPTR at 0.10 µA and 0.70 µA — 40% larger than the 56 ps quoted in the manufacturer's datasheet. Future measurements should use a calibrated photodiode or spectrometer for direct optical power measurement, and should investigate whether fibre path differences or laser head aging account for the discrepancy.
DCR at 100 K confirms strong cryogenic suppression. Even at 1×10¹³ neq/cm² — 3× above the nominal HL-LHC fluence — the dark count rates at moderate overvoltages remain manageable, validating the cryogenic cooling strategy for the LHCb Upgrade II SciFi detector.
Non-Poissonian statistics from competing noise sources. A phenomenological model P(t) = (CDCe−RDCt + CAPe−RAPt)(1 − e−t/τrec) is proposed to jointly describe afterpulsing and recovery-time suppression. A systematic study across fluence levels and temperatures would constrain RDC, RAP, and τrec independently.
Both studies directly support detector R&D at LPHE for the LHCb Upgrade II program. The SPTR measurements establish the timing performance achievable with current FBK prototype cells. The cryogenic DCR measurements provide the first data point at 1×10¹³ neq/cm² for the specific packaging geometry under development, informing the cooling system design that will keep SiPMs below 150 K throughout the HL-LHC run.
All Research