Semester Project (TP4b) · 2025
SiPM Single Photon Time Resolution Measurement
Overview
Silicon Photomultipliers (SiPMs) are the detector of choice across high-energy physics experiments, medical imaging, and time-of-flight systems. Their timing performance — how quickly and precisely they register the arrival of a single photon — is a critical figure of merit. In the worst-case scenario where only one photon arrives, the detector's Single Photon Time Resolution (SPTR) sets the fundamental timing floor for the entire system.
This project measured the SPTR of seven SiPM models from three manufacturers (Hamamatsu, FBK, and single-channel Hamamatsu) across a wide range of over-voltages (2–12 V). Using oscilloscope waveform acquisition, threshold-crossing analysis, and Exponentially Modified Gaussian (EMG) fitting, I established SPTR values and decomposed the total timing spread into contributions from electronics jitter, laser statistics, and intrinsic device effects. The FBK SiPM with a microlens array (FBKW342004_µLens) achieved the best SPTR of 80.74 ± 0.53 ps at 5 V over-voltage — a performance advantage attributable to its focused photon delivery reducing intrinsic spread.
SiPM Physics & Sources of Timing Uncertainty
A SiPM is an array of Single-Photon Avalanche Diodes (SPADs), each biased above its breakdown voltage in Geiger mode. An incoming photon triggers an avalanche of electron–hole pairs; the quenching resistor in series momentarily drops the bias below breakdown, stopping the avalanche and resetting the cell. The combined output is an analog sum of all fired cells.
SPTR captures how much the arrival-time measurement spreads across repeated single-photon events. Five physical and instrumental mechanisms contribute:
- Intrinsic spread: Non-uniform electric field within each SPAD microcell means absorption position governs how quickly the avalanche builds. Photons absorbed far from the centre of the high-field region trigger avalanches more slowly.
- Transit time skew: Signals from microcells physically further from the readout connection arrive slightly later due to the finite propagation delay along the metal lines.
- Trigger time spread: The synchronisation signal from the laser driver has its own jitter (<20 ps in this setup).
- Laser pulse statistics: The laser pulse itself has a temporal width of approximately 56 ps (measured via manufacturer specification at the power level used).
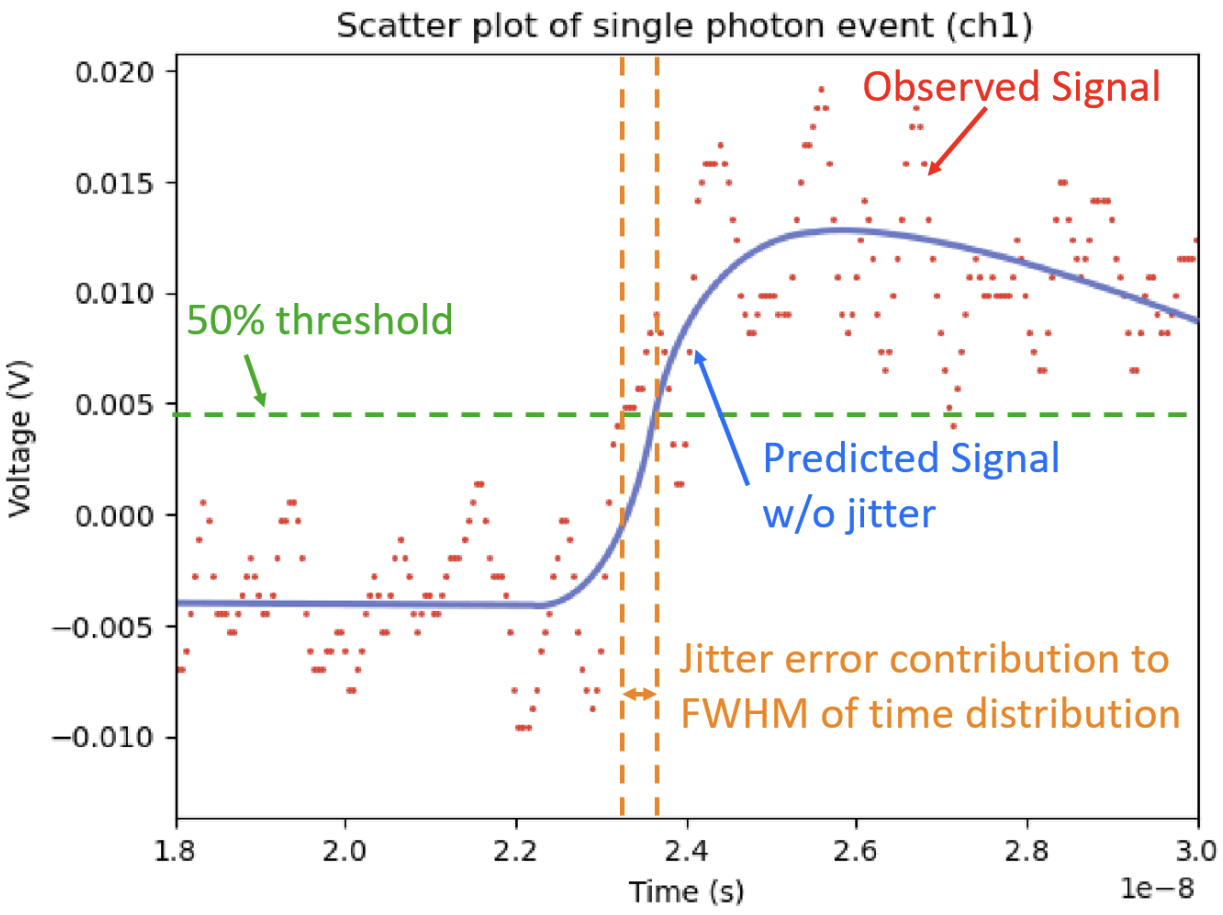
- Electronics jitter: Baseline noise in the amplifier and oscilloscope chain causes the threshold crossing time to fluctuate even for identical signals. This is quantified as FWHMjitter = 2.3458 × σbackground / |average gradient|.
Experimental Setup
All measurements were performed in a dedicated SiPM room at LPHE (2nd floor). A pulsed laser (∼400 nm) was directed through a light-tight Faraday box onto the SiPM under test. Signals passed through a 40 dB wideband amplifier before being digitised at 20 GSa/s by a Teledyne LeCroy 12-bit oscilloscope, then transferred to a computer for offline analysis.
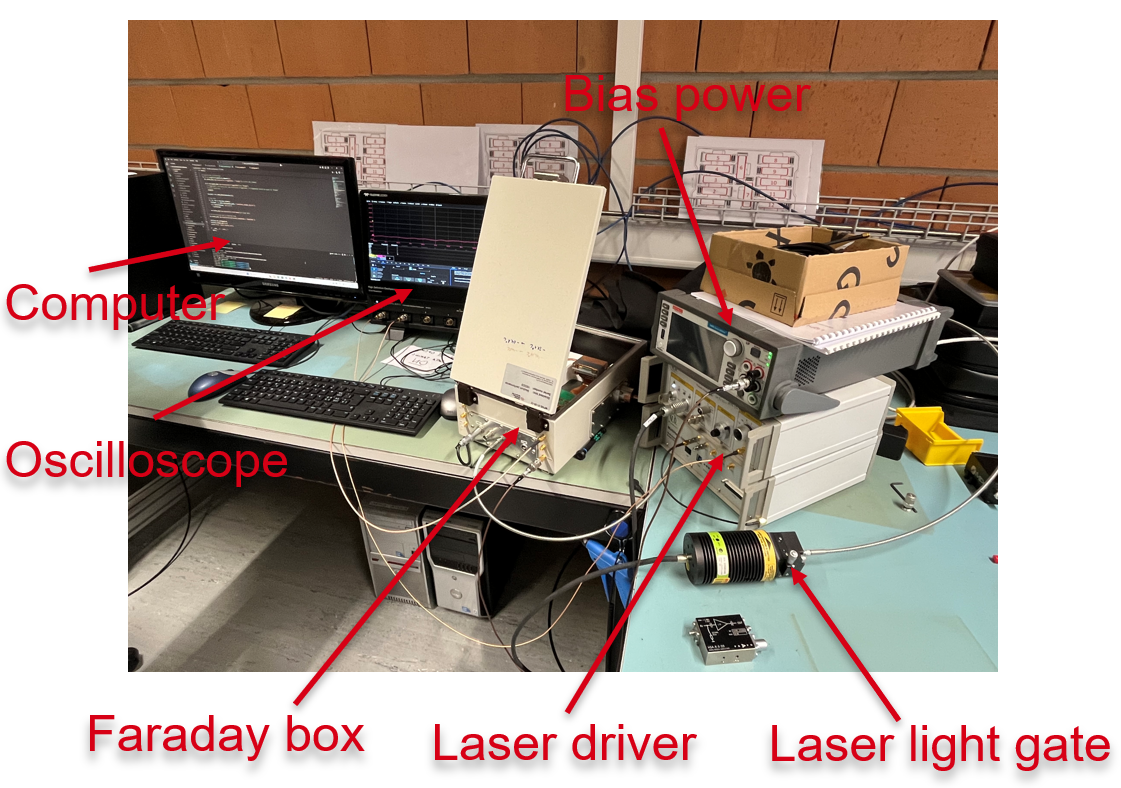
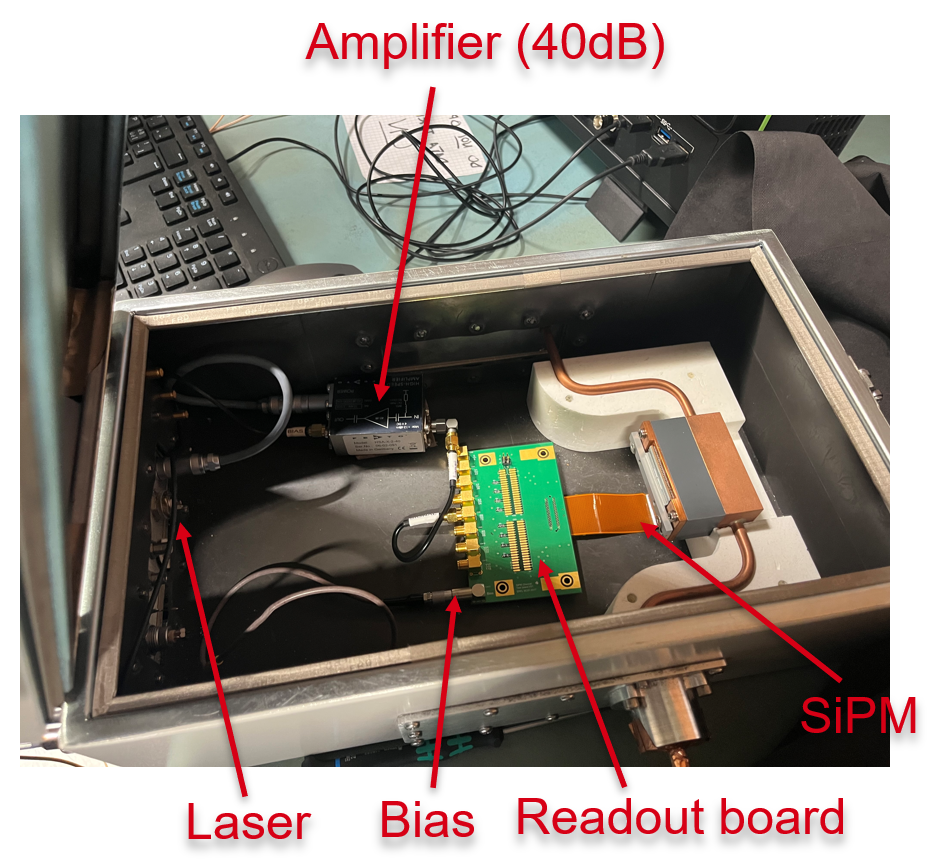
Key acquisition parameters: 50,000 waveforms per over-voltage setting; 50 ps sampling interval; 12-bit vertical resolution. The readout board connects one SiPM channel at a time, preventing crosstalk from adjacent channels. Over-voltage was scanned from 2.0 V to 9.0 V in 0.5 V steps for most devices, extending to 12.0 V for FBK models.
Devices Under Study
Seven SiPM models were characterised, spanning three technology families: multichannel FBK arrays, multichannel Hamamatsu arrays, and large-area single-channel Hamamatsu devices.
| SiPM | Type | Pixel Size | Channels analysed |
|---|---|---|---|
| FBKW942087 | FBK multichannel array | — | 21, 37, 69, 85, 101 |
| FBKW342004_µLens | FBK multichannel array + microlens | — | 69, 85, 101 |
| H202442058 | Hamamatsu multichannel array | 42 × 42 µm² | 22, 37, 53, 54, 69, 85 |
| H202450038 | Hamamatsu multichannel array | 50 × 50 µm² | 53, 69, 85, 101 |
| S13360_2 | Single-channel Hamamatsu | — | 1 |
| S14160_3 | Single-channel Hamamatsu | — | 1 |
| S13360_6 | Single-channel Hamamatsu (filtered) | — | 1 |
The FBKW342004_µLens is equipped with a microlens array that focuses incoming photons toward the centres of microcells, where the electric field is strongest. This reduces the intrinsic timing spread by ensuring avalanches always initiate in the highest-field region.
Analysis Method
Step 1 — Event Separation
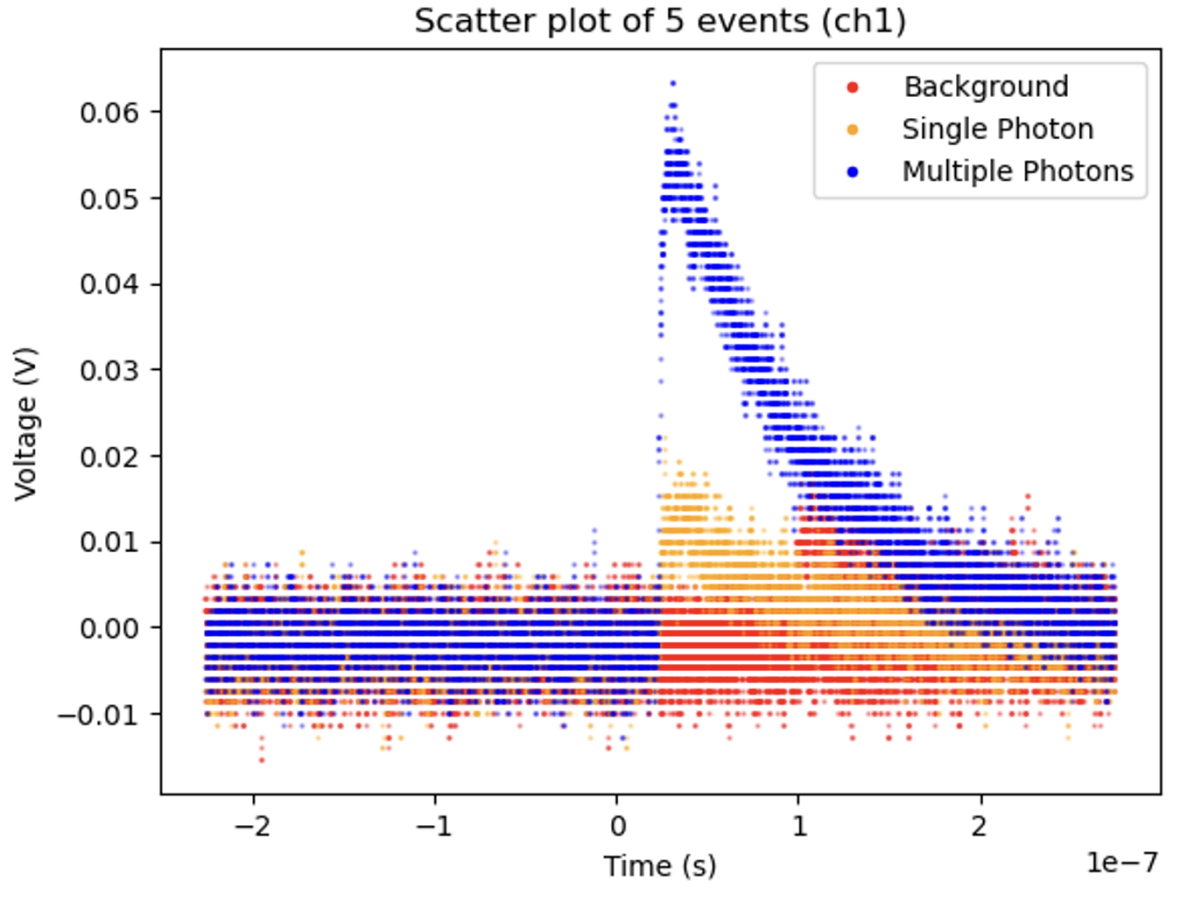
Each waveform is classified into one of three categories — background, single-photon, or multiple-photon — based on its maximum amplitude within a defined time window. The time window is chosen to bracket the laser pulse. The amplitude histogram shows distinct peaks corresponding to each category; voltage thresholds between peaks define the classification boundaries.
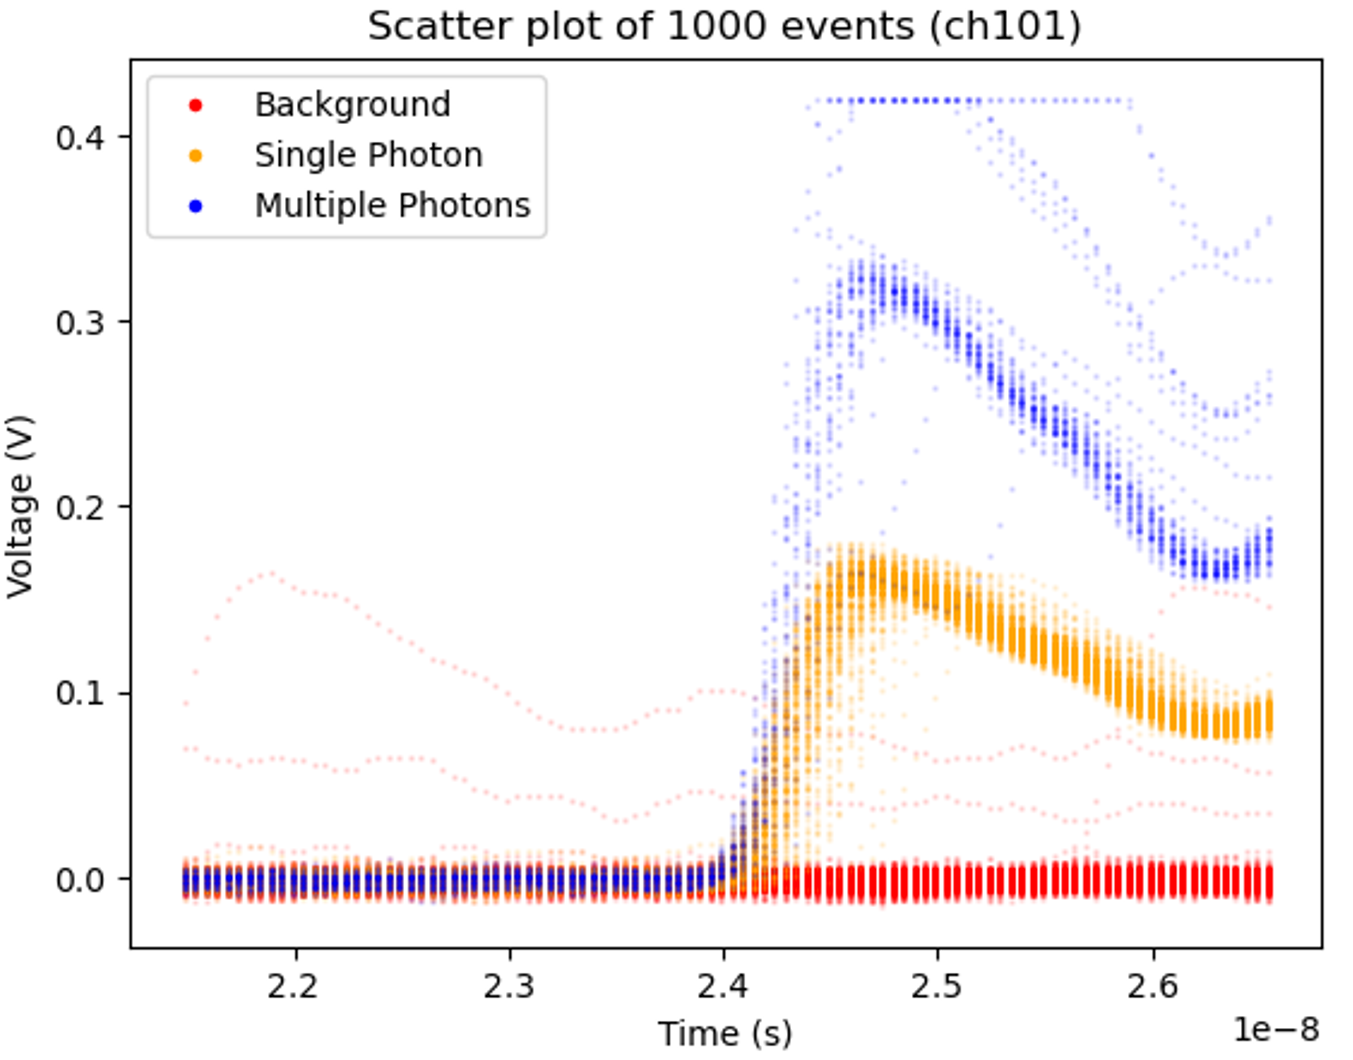
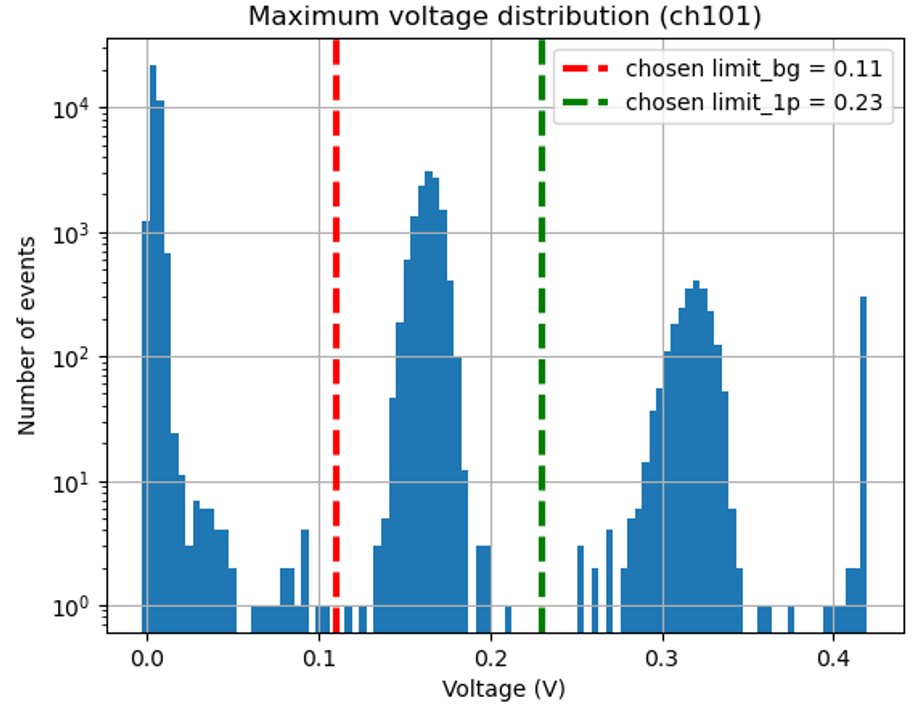
For single-channel SiPMs with poor signal-to-noise ratio, a voltage pre-filter is applied: only waveforms whose baseline (measured before the signal window) is within the first peak of the pre-signal amplitude distribution are accepted. This removes events where residual thermal noise has not yet decayed before the laser pulse, significantly improving peak separation.
Step 2 — Background Subtraction
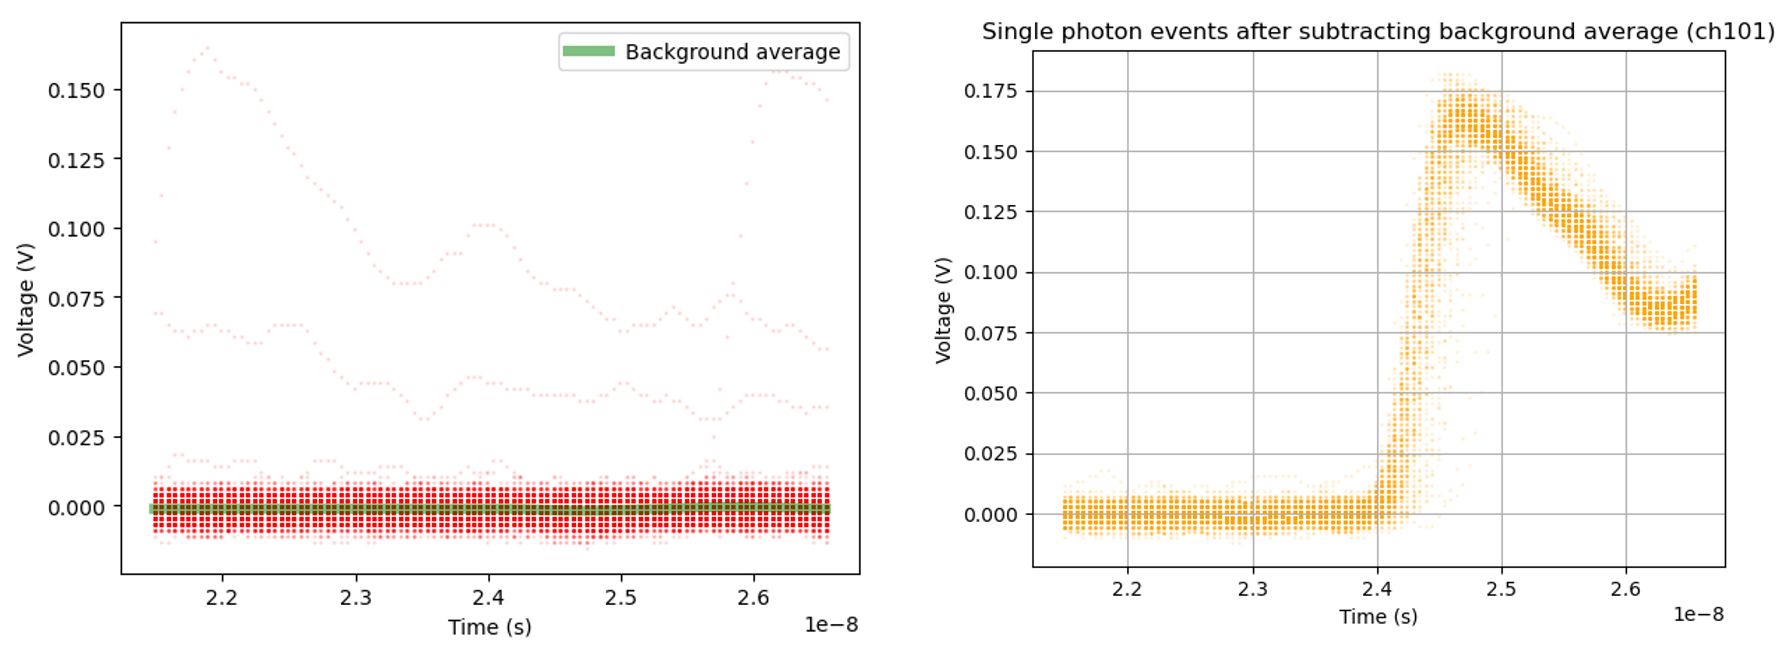
The mean waveform of all background events is subtracted from each single-photon waveform. This corrects for any slowly-varying baseline offset common to all events, isolating the pure SiPM response to a single photon.
Step 3 — Time Distribution & EMG Fitting
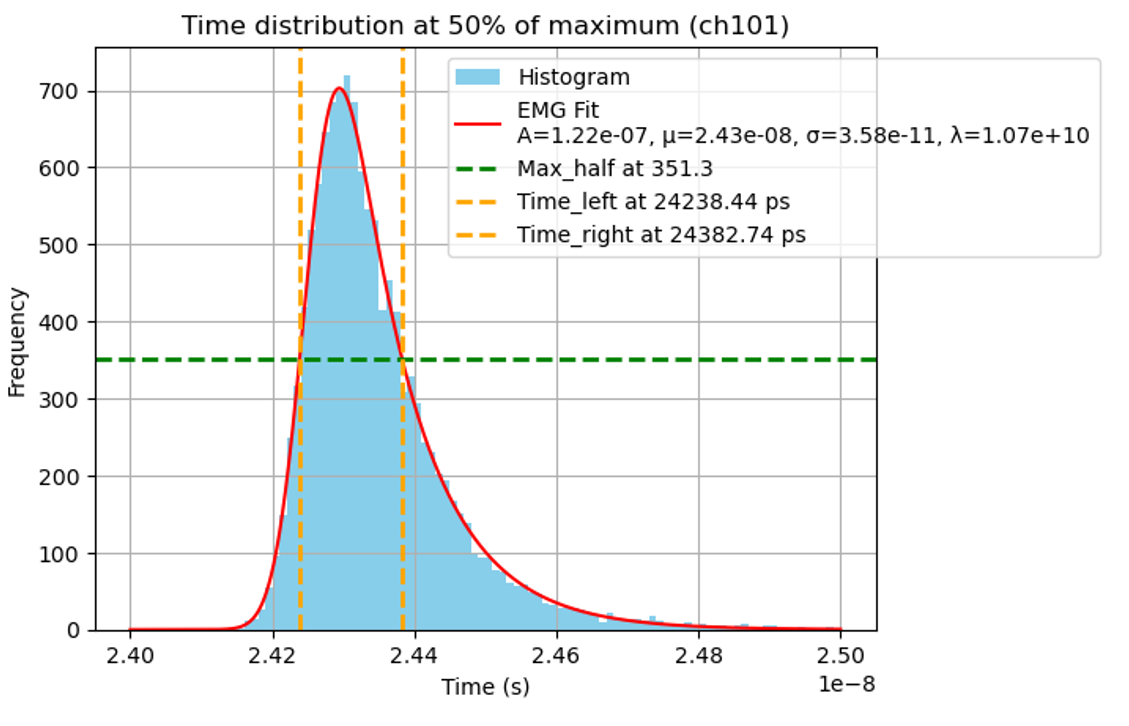
For each single-photon event, the time at which the waveform crosses a chosen fraction of its peak amplitude is recorded by linear interpolation between the two bracketing samples. This is repeated across all threshold fractions from 10% to 90%. The resulting time distribution at each threshold is binned into a histogram with bin width ≥ 14.43 ps — the standard deviation of the uniform distribution over one 50 ps sampling interval — to avoid artificially sharpening the resolution.
An Exponentially Modified Gaussian (EMG) is fitted to each histogram. The EMG combines a Gaussian core (σ, capturing the symmetric part of the timing spread) with an exponential tail (λ, capturing late arrivals from slow avalanche initiations):
f(x; µ, σ, λ) = (λ/2) · exp[(λ/2)(2µ + λσ² − 2x)] · erfc[(µ + λσ² − x) / (√2 σ)]
The FWHM of the fitted curve is extracted by finding the half-maximum crossing times via root-finding on the fit function. Uncertainties on FWHM are propagated from the covariance matrix of the fit parameters.
Step 4 — Optimal Threshold & Jitter Decomposition
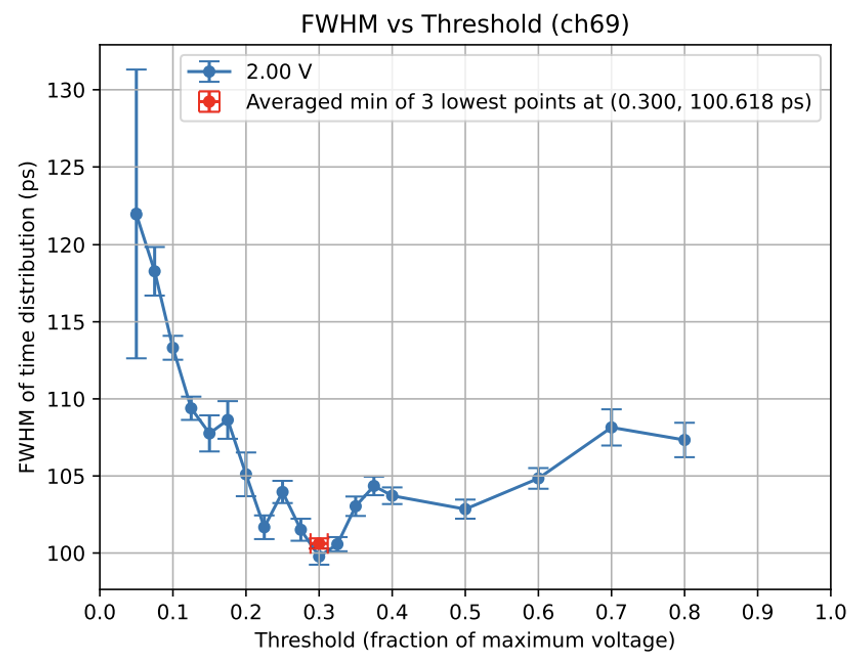
The FWHM is computed for every threshold fraction (10–90%). Because jitter decreases with increasing signal gradient, and the gradient is largest near the 50% point, the FWHM typically reaches a minimum around 30–50%. The characteristic SPTR for each over-voltage is taken as the average of the three lowest FWHM values across thresholds.
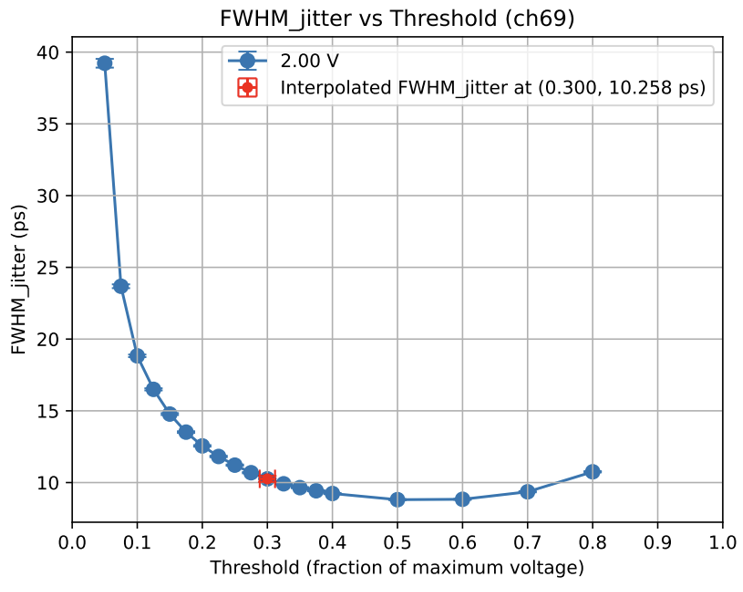
The jitter contribution FWHMjitter = 2.3458 × σbg / ⟨gradient⟩ is interpolated to the optimal threshold. The pure device SPTR is then extracted via quadrature subtraction:
FWHM²meas = FWHM²jitter + FWHM²trigger + FWHM²laser + FWHM²others
With FWHMlaser = 56 ps (characterised) and FWHMtrigger < 20 ps (treated as an asymmetric lower-bound error), FWHMothers represents the combined intrinsic device contributions — primarily intrinsic spread and transit time skew.
Results
Per-Channel SPTR vs. Over-Voltage
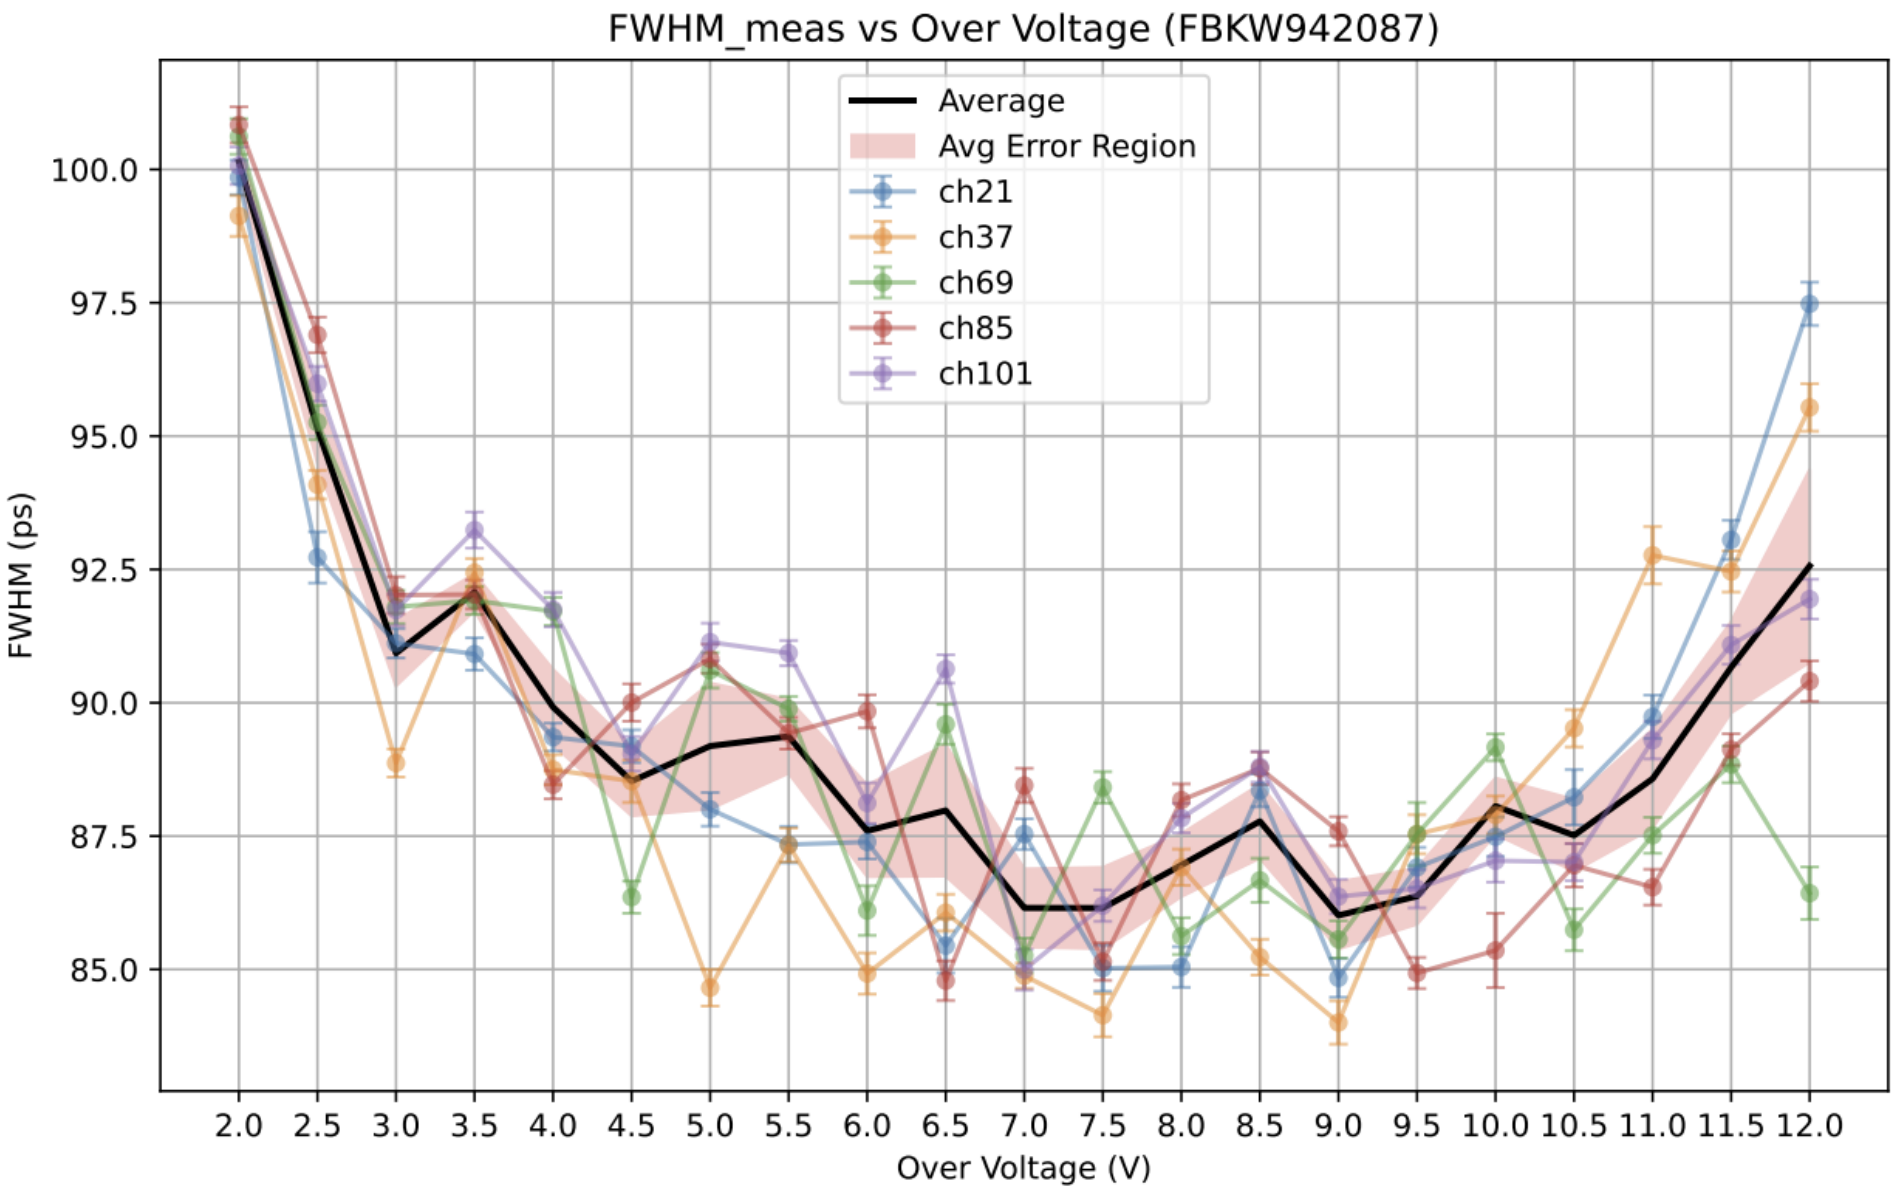
For multichannel arrays, SPTR is measured independently for each channel and then averaged. All channels of a given device show consistent saturation behaviour, validating the uniformity of the manufacturing process. For FBKW942087 the minimum FWHMmeas saturates around 8 V OV at approximately 81.66 ps for the best-performing channel.
FWHM Breakdown
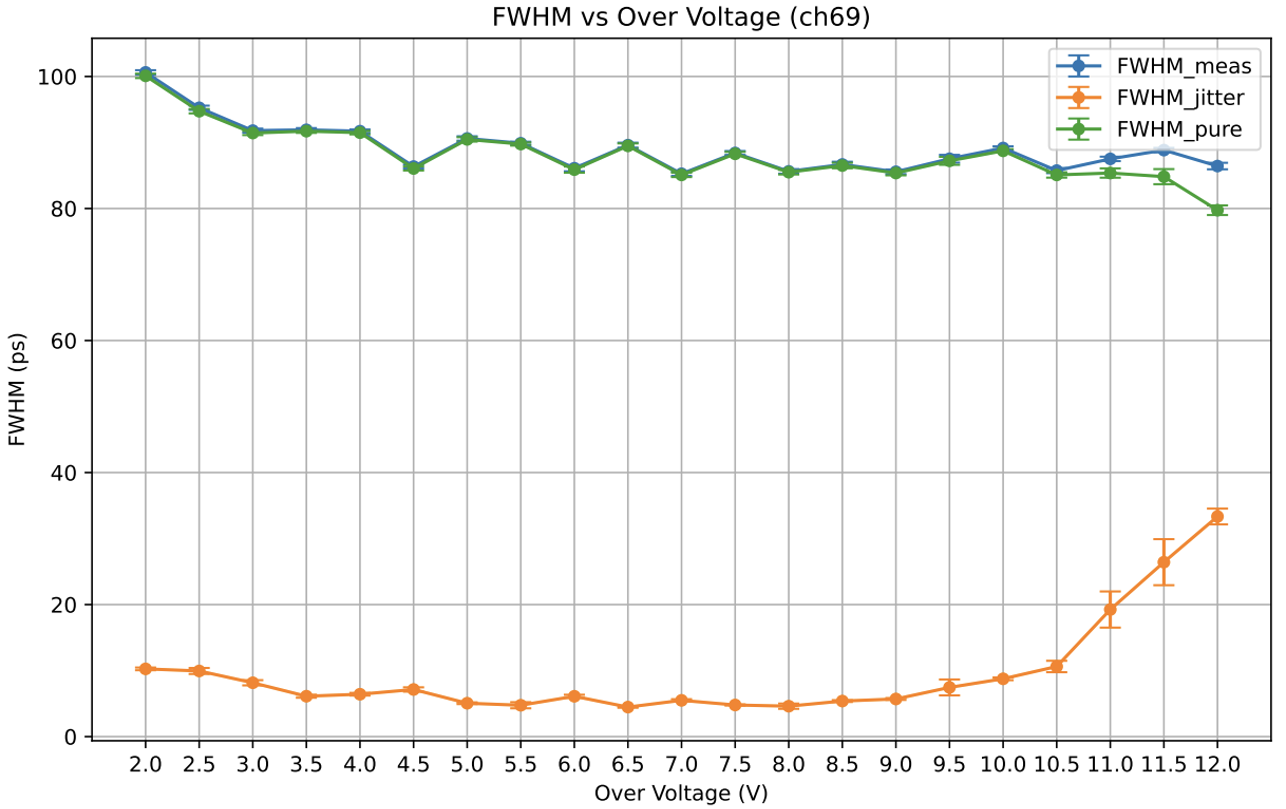
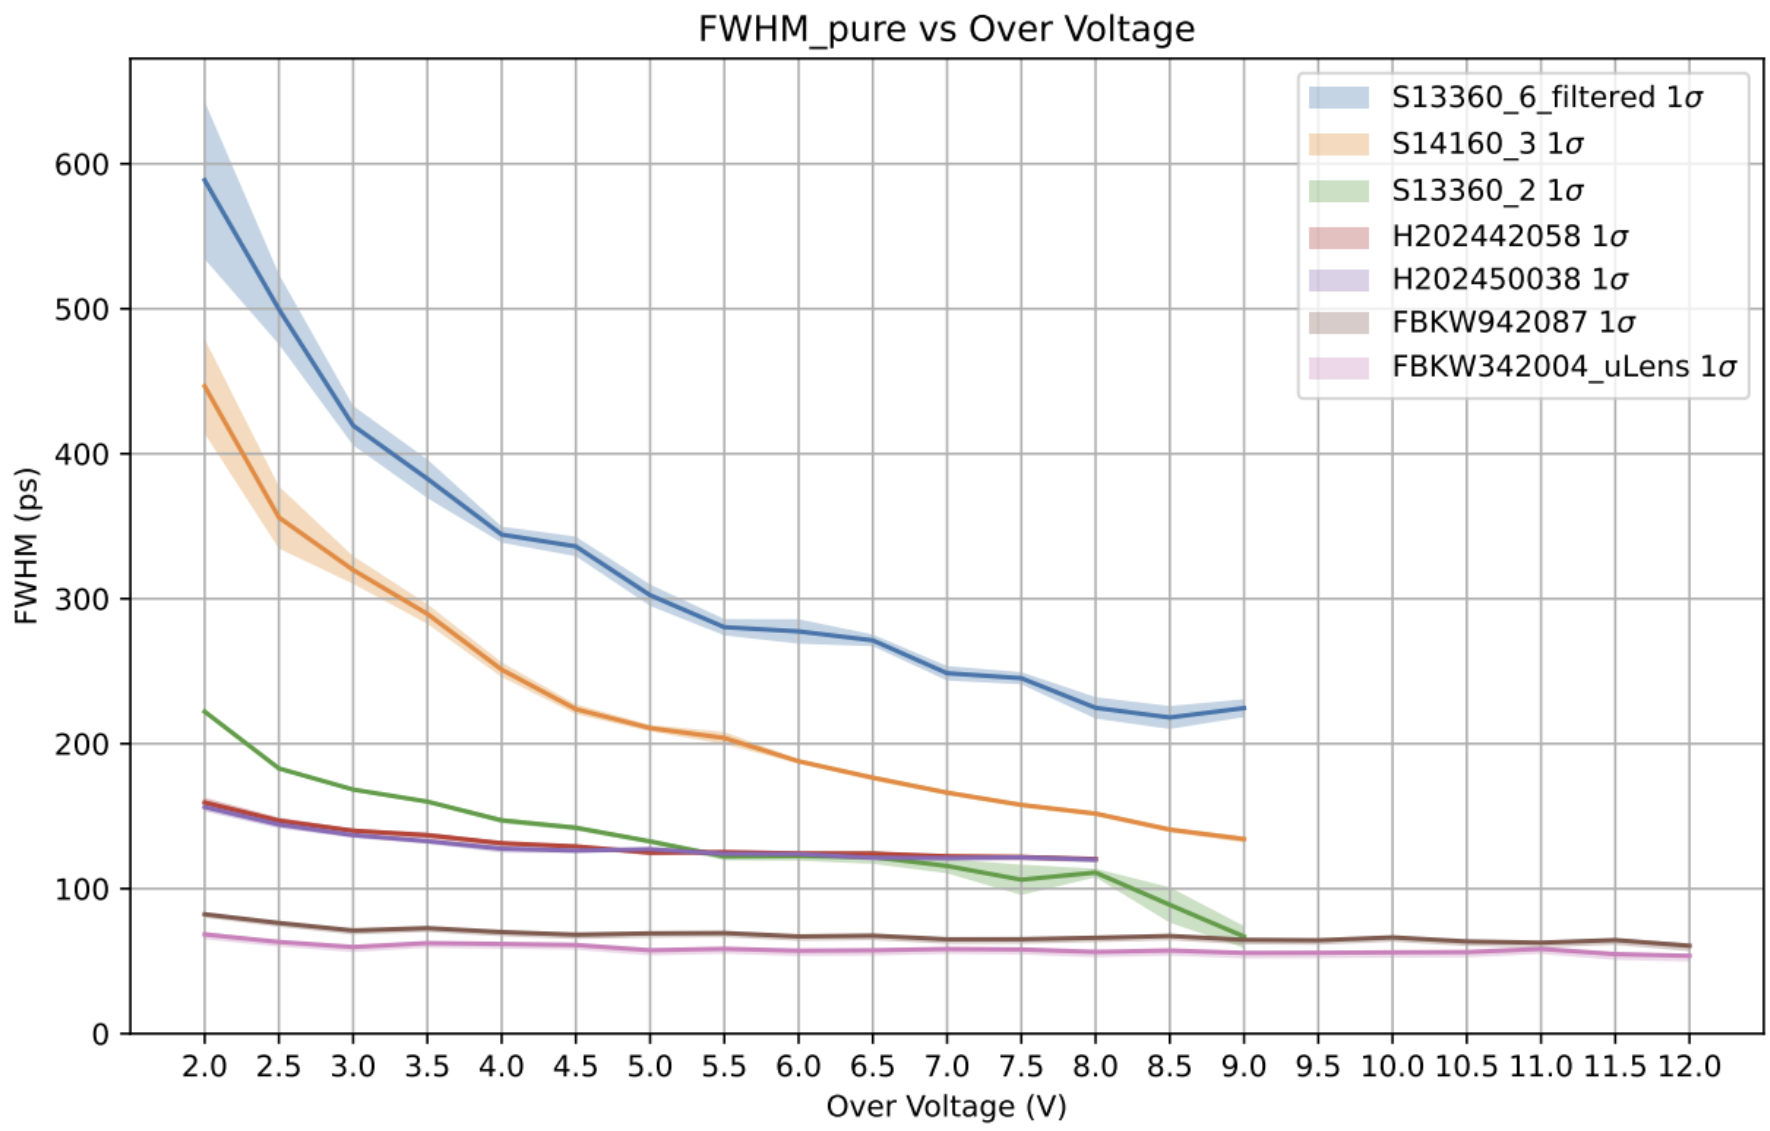
Decomposing the measured FWHM into jitter, laser, and intrinsic contributions shows that at moderate over-voltages (3–8 V), FWHMjitter is small (<15 ps for FBK channels) and the dominant limitation is FWHMothers — the intrinsic spread and transit time skew.
FBK: Effect of Microlens
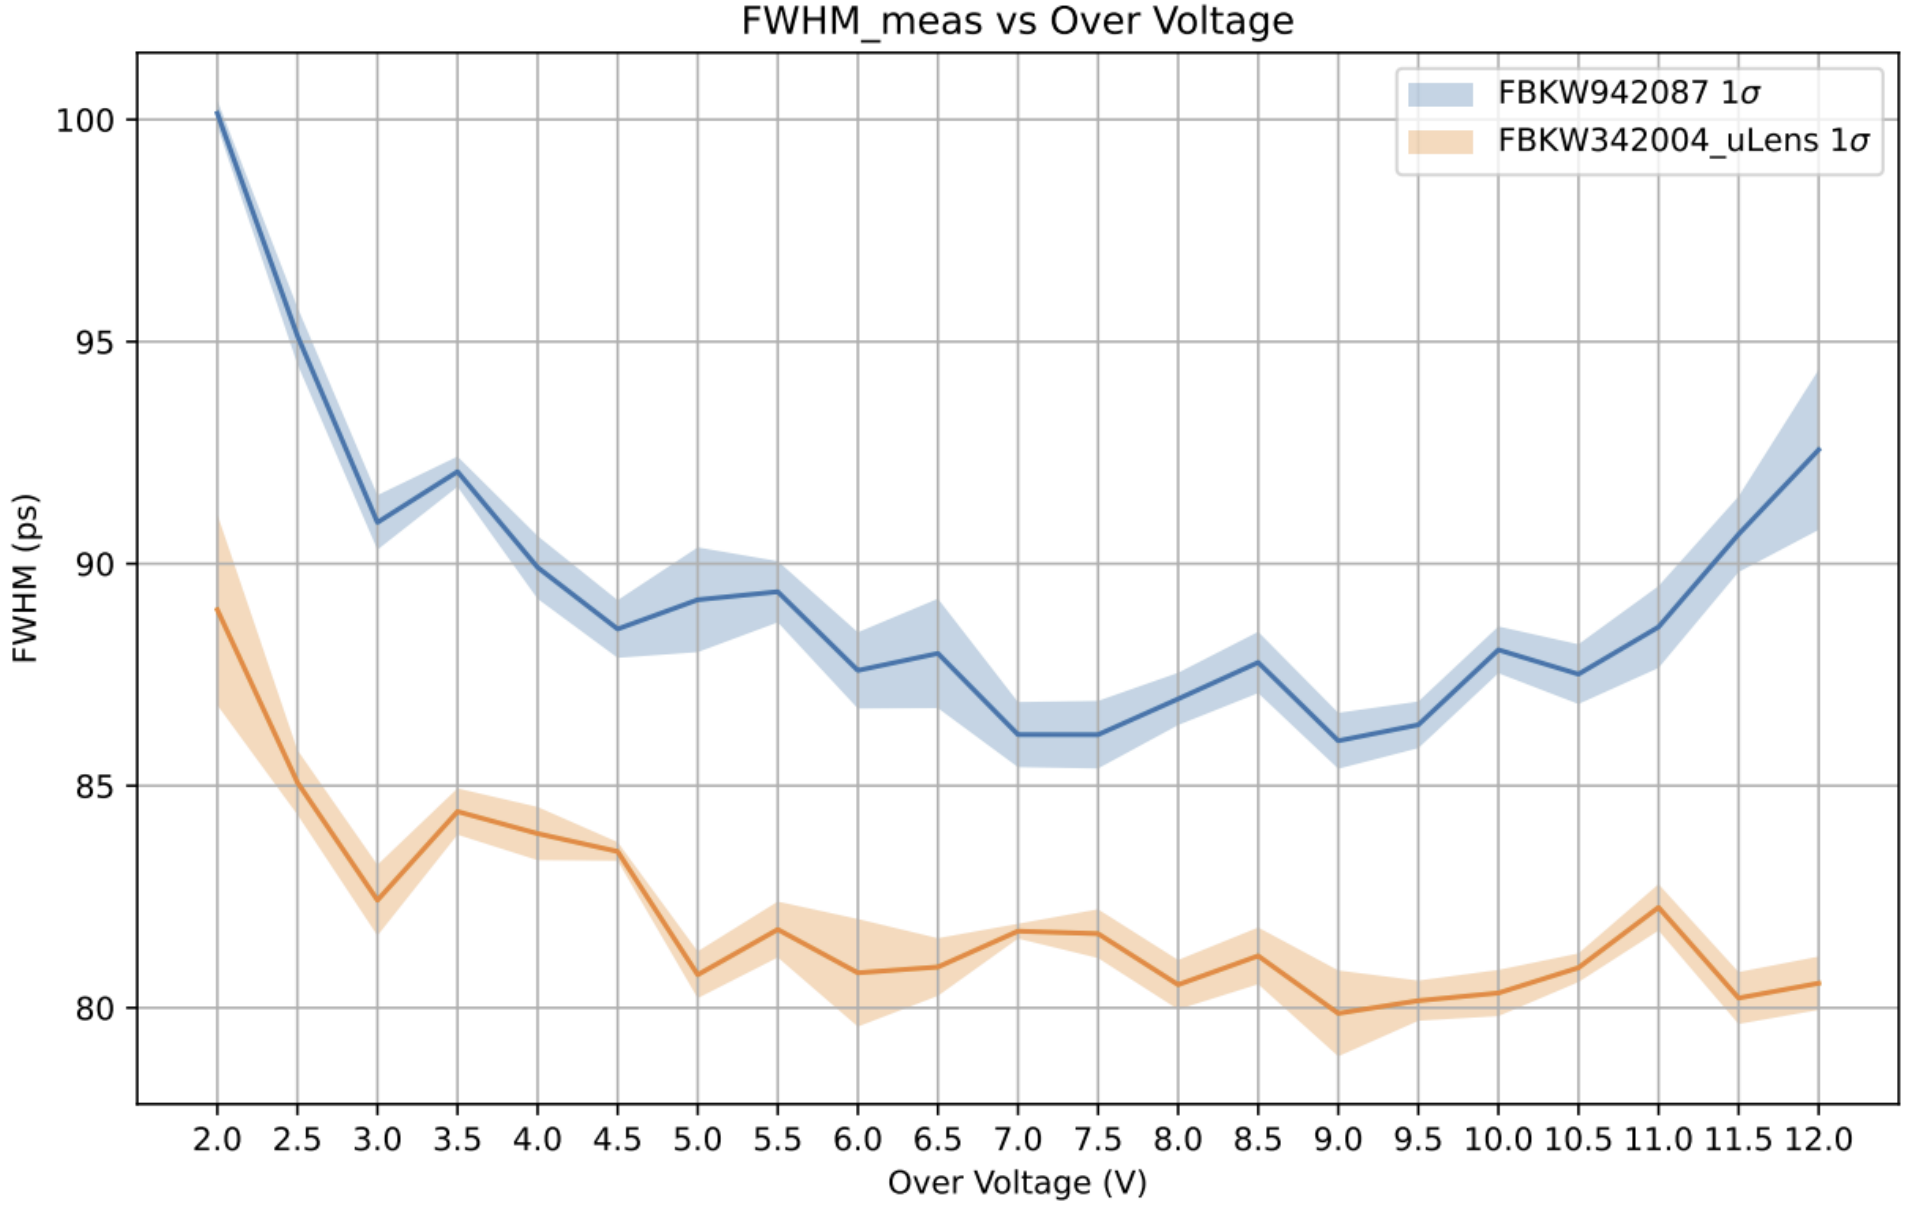
Comparing the standard FBKW942087 against the FBKW342004_µLens reveals a consistent ~5 ps advantage for the microlens device across the full OV range. After jitter correction, this advantage persists in FWHMothers, confirming that the microlens reduces intrinsic spread by directing photons to the high-field cell centres where avalanche initiation is fastest and most reproducible.
Hamamatsu: 42 µm vs. 50 µm Pixels
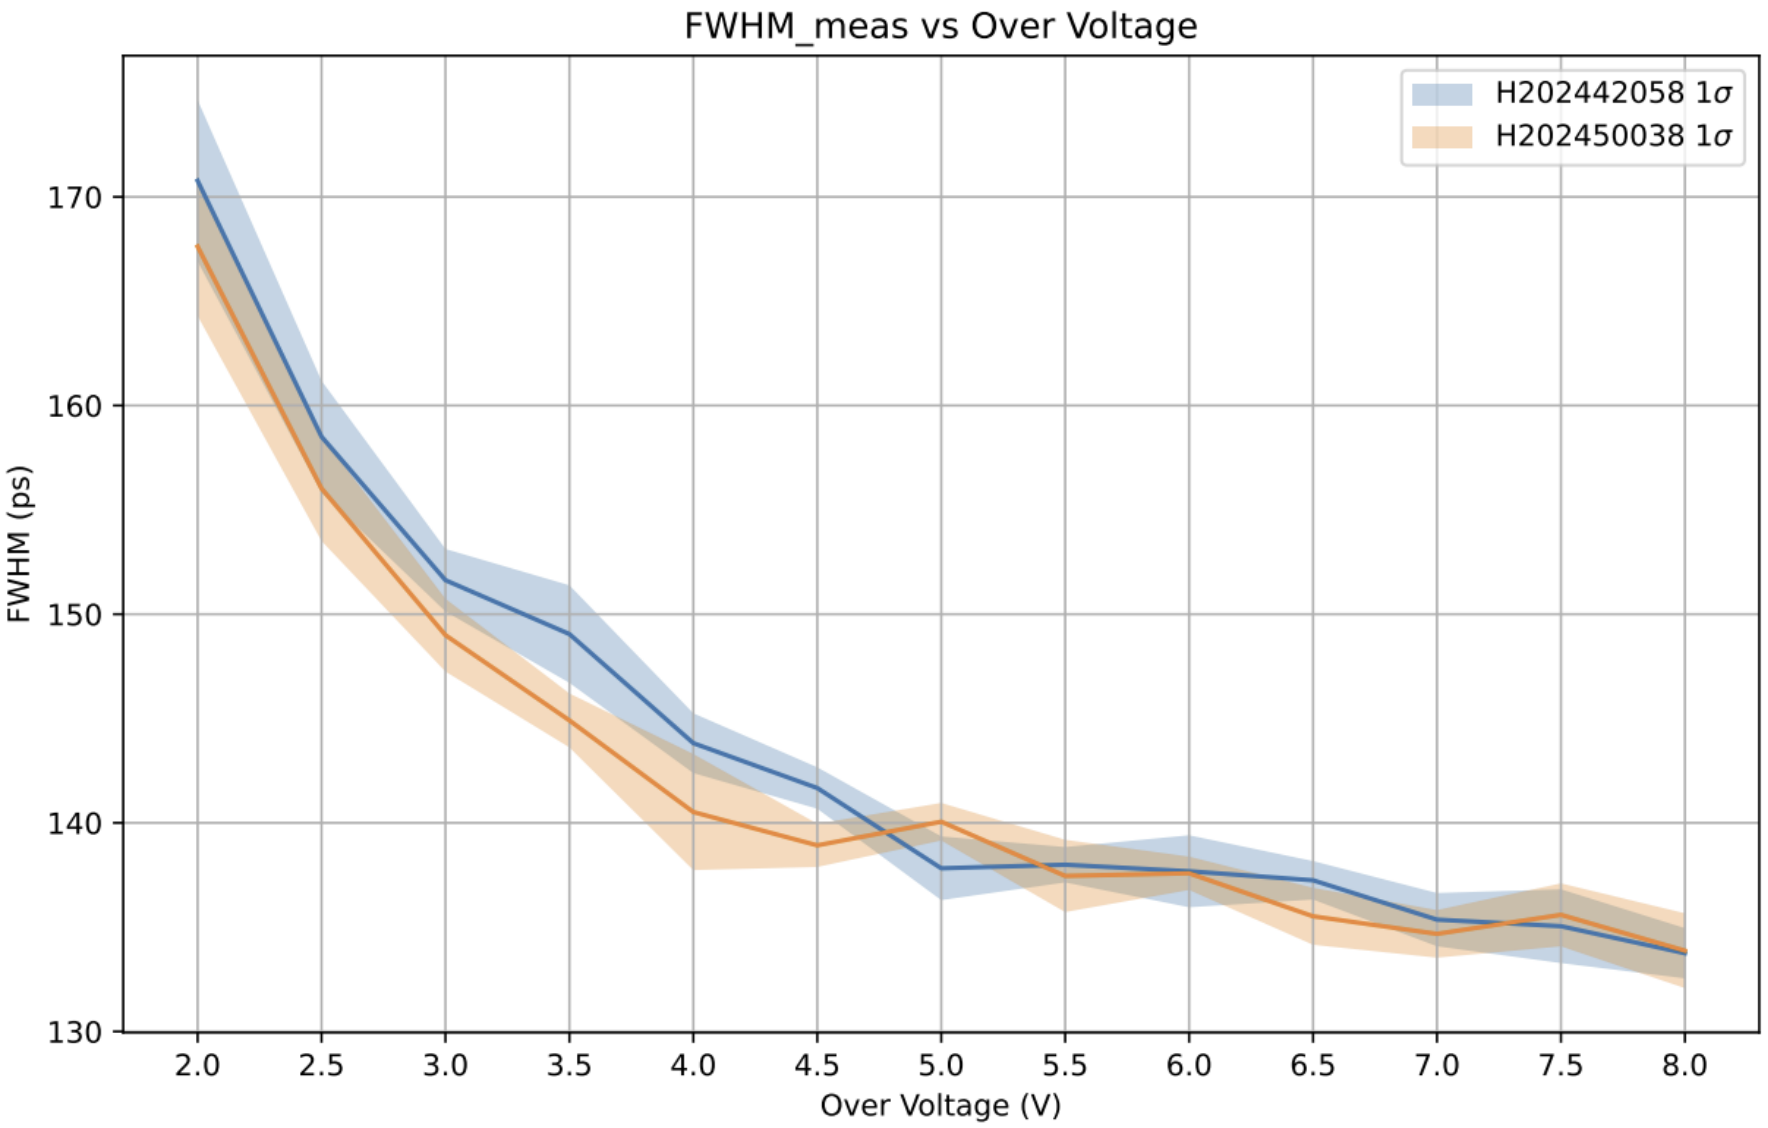
Despite the different pixel geometries, H202442058 (42 µm pitch) and H202450038 (50 µm pitch) deliver nearly identical SPTR performance. The larger pixel's higher background noise is precisely offset by its steeper signal gradient, producing the same net jitter — a coincidental balance that validates the jitter formula's predictive power.
Single-Channel SiPMs
Large-area single-channel SiPMs present a more challenging analysis. The signal amplitude is comparable to baseline noise, and residual thermal noise at the start of waveforms blurs the amplitude histogram peaks. The voltage pre-filter described in Section 5 significantly improves peak separation for the S13360_6 device. Even after filtering, the single-channel SiPMs show substantially worse SPTR due to their large number of cells (increasing transit time skew), lower signal gain, and greater susceptibility to thermal noise.
All SiPMs: Full Comparison
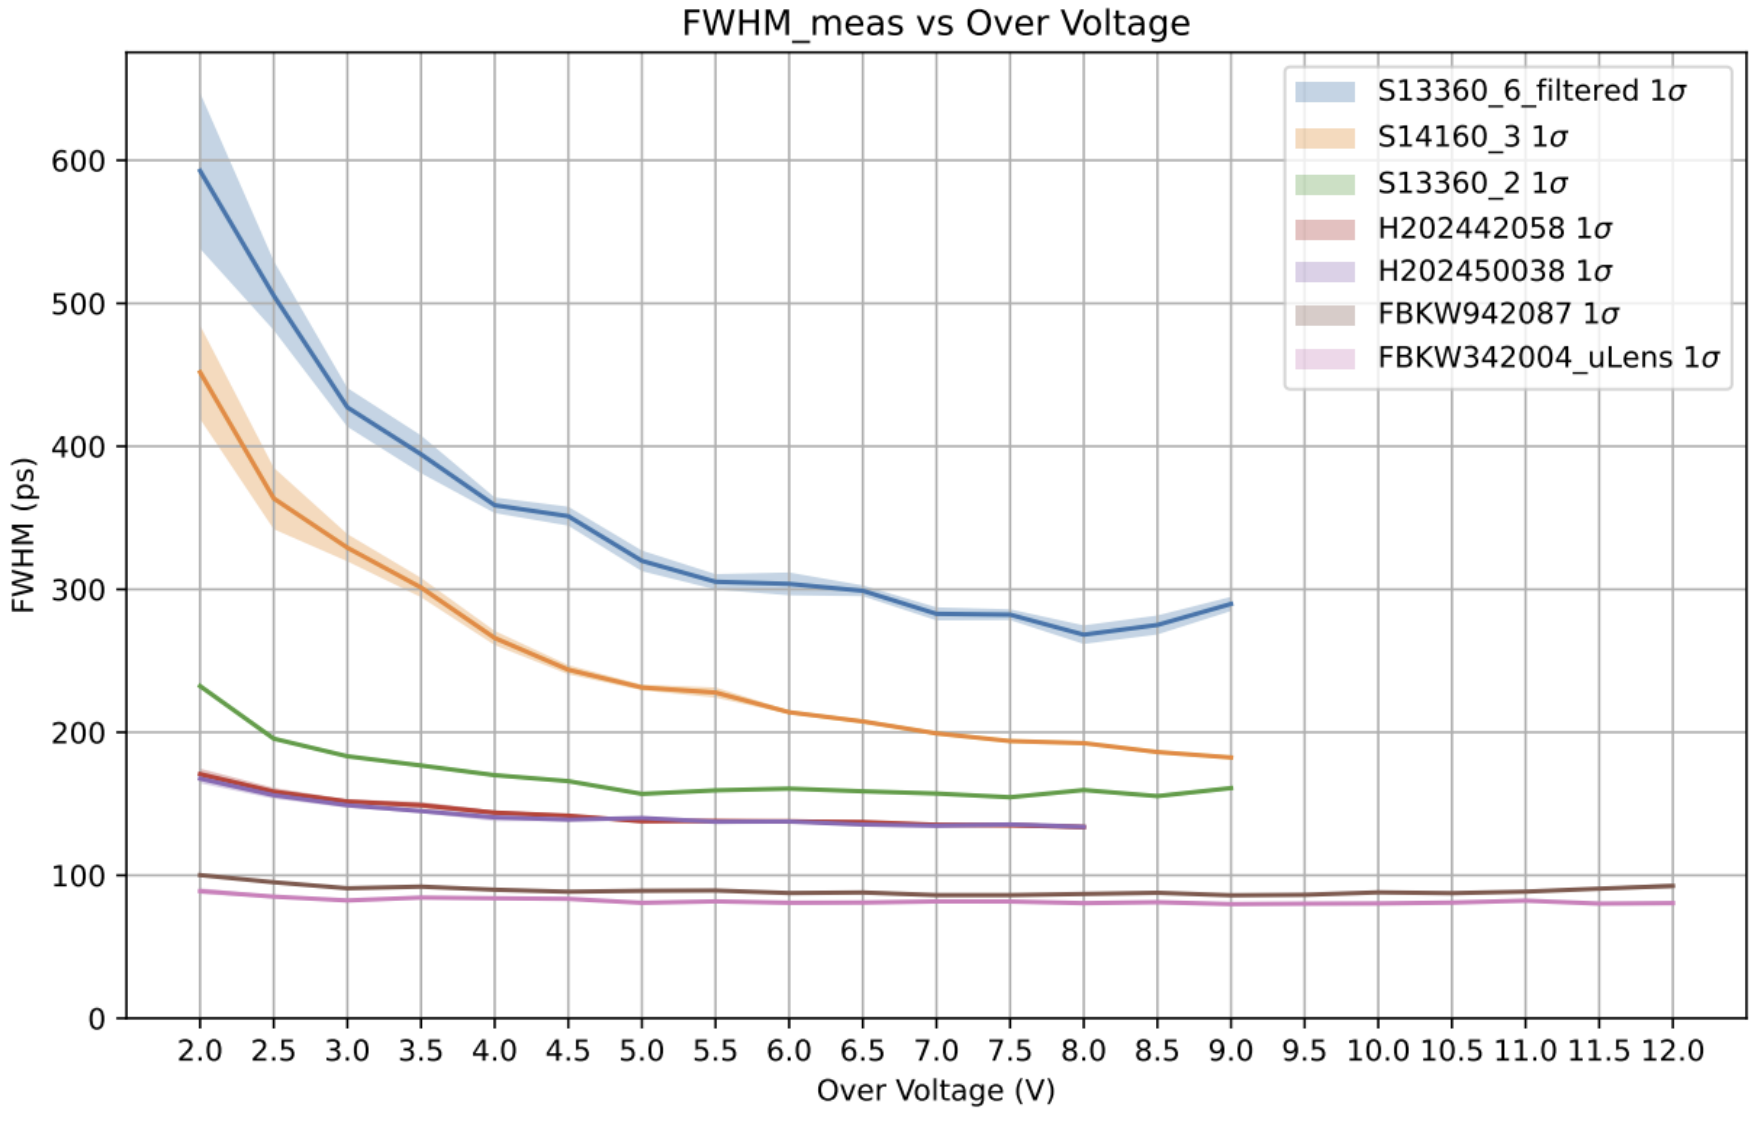
Performance ranking at 5.0 V OV: FBKW342004_µLens (80.74 ps) > FBKW942087 (89.19 ps) > H202442058 (137.82 ps) ≈ H202450038 (140.05 ps) > S13360_2 (156.94 ps) > S14160_3 (231.35 ps) > S13360_6 filtered (319.89 ps).
| SiPM | FWHMmeas at 5 V | FWHMjitter at 5 V | FWHMothers at 5 V |
|---|---|---|---|
| S13360_6 (filtered) | 319.89 ± 7.21 ps | 87.95 ± 0.53 ps | 302.43 ps |
| S14160_3 | 231.35 ± 2.01 ps | 77.18 ± 1.92 ps | 210.79 ps |
| S13360_2 | 156.94 ± 0.85 ps | 62.48 ± 1.31 ps | 132.62 ps |
| H202450038 | 140.05 ± 0.90 ps | 17.52 ± 2.64 ps | 127.20 ps |
| H202442058 | 137.82 ± 1.53 ps | 10.49 ± 1.18 ps | 124.83 ps |
| FBKW942087 | 89.19 ± 1.18 ps | 5.45 ± 0.29 ps | 69.17 ps |
| FBKW342004_µLens | 80.74 ± 0.53 ps | 9.19 ± 0.18 ps | 57.51 ps |
Summary
FBK SiPMs lead in SPTR: At 5 V OV, FBKW342004_µLens achieves 80.74 ps and FBKW942087 achieves 89.19 ps — roughly 40% better than Hamamatsu multichannel arrays. The microlens delivers a further ~12% improvement over the standard FBK device by focusing photons to the high-field microcell centre.
Pixel size is not the limiting factor for Hamamatsu: The 42 µm and 50 µm devices perform identically because their higher noise and steeper gradient cancel exactly in the jitter formula — both land near 135–140 ps at saturation.
Electronics jitter dominates for single-channel SiPMs: FBK channels have jitter <10 ps at 5 V OV; single-channel SiPMs reach 60–90 ps jitter due to their weaker signals relative to baseline noise. Filtering residual thermal events reduces the apparent SPTR but the fundamental SNR limitation remains.
EMG is physically motivated: The asymmetric right tail in the time distribution arises from slow avalanche initiations at cell edges (weak-field regions), which take longer to build up. The exponential tail width λ⁻¹ characterises the timescale of these slow events. At high OV, the field becomes more uniform and the tail shrinks accordingly.
This work provides a quantitative baseline for SiPM selection in time-critical applications at LPHE, informing ongoing choices for LHCb detector upgrades. The jitter decomposition methodology and voltage pre-filtering technique developed here are directly applicable to future SPTR measurements at cryogenic temperatures, where SiPM timing properties change substantially — the direction explored in the follow-on Dark Count Rate at Cryogenic SiPMs project.
All Research