Bachelor Project · 2024
CTH Detector Response Simulation for the COMET Experiment
Overview
The COherent Muon to Electron Transition (COMET) experiment at J-PARC, Japan, aims to detect the neutrinoless conversion of a muon into an electron — a process forbidden by the Standard Model but predicted by several Beyond Standard Model (BSM) theories at branching ratios of O(10⁻¹⁵). The signal electron appears at a characteristic momentum of 105 MeV/c, and the experiment's central challenge is distinguishing it from a large background of other charged particles (muons, pions) at similar momenta.
The Cylindrical Trigger Hodoscope (CTH) is a key sub-detector of the COMET Phase-I Cylindrical Detector (CyDet). Using a Geant4-based Monte Carlo simulation, this project systematically characterised how e⁻, µ⁺, and π⁺ particles at momenta of 105, 125, 150, and 200 MeV/c interact with the CTH scintillator counters. Their impact locations, path lengths, momentum distributions, and energy deposition profiles were extracted and analysed.
The key result is that at 105 MeV/c — COMET's signal momentum — the energy deposition of e⁻ is distinctly lower than that of µ⁺ and π⁺, confirming the CTH's ability to separate signal from background. Fitted most-probable-values (MPVs) from Landau and Moyal distributions are in good agreement with Bethe-Bloch formula predictions, with identified systematic offsets explained by physical effects such as delta-ray contamination and pion decay.
Background
The COMET Experiment & CTH Detectors
COMET searches for µ⁻N → e⁻N, where a negative muon captured in orbit around a nucleus converts coherently to an electron without emitting neutrinos. In the Standard Model this is suppressed to an unobservable branching ratio of O(10⁻⁵⁴); BSM theories predict it at O(10⁻¹⁵), within reach of Phase-I sensitivity. The signal is a monoenergetic 105 MeV/c electron — but it must be pulled from backgrounds of decay-in-orbit (DIO) electrons, cosmic muons, and pion contamination in the beam.
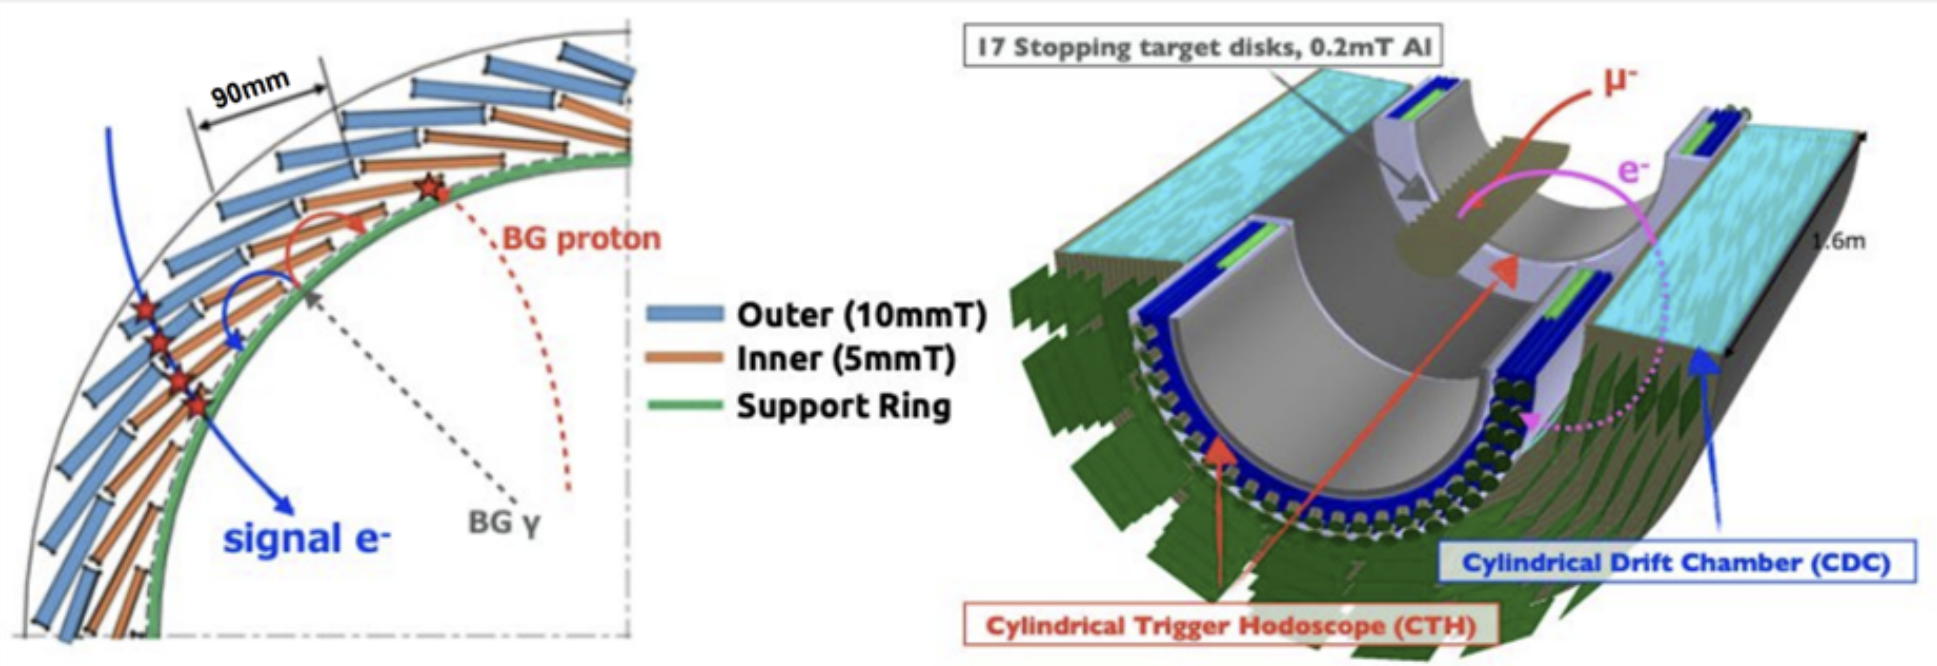
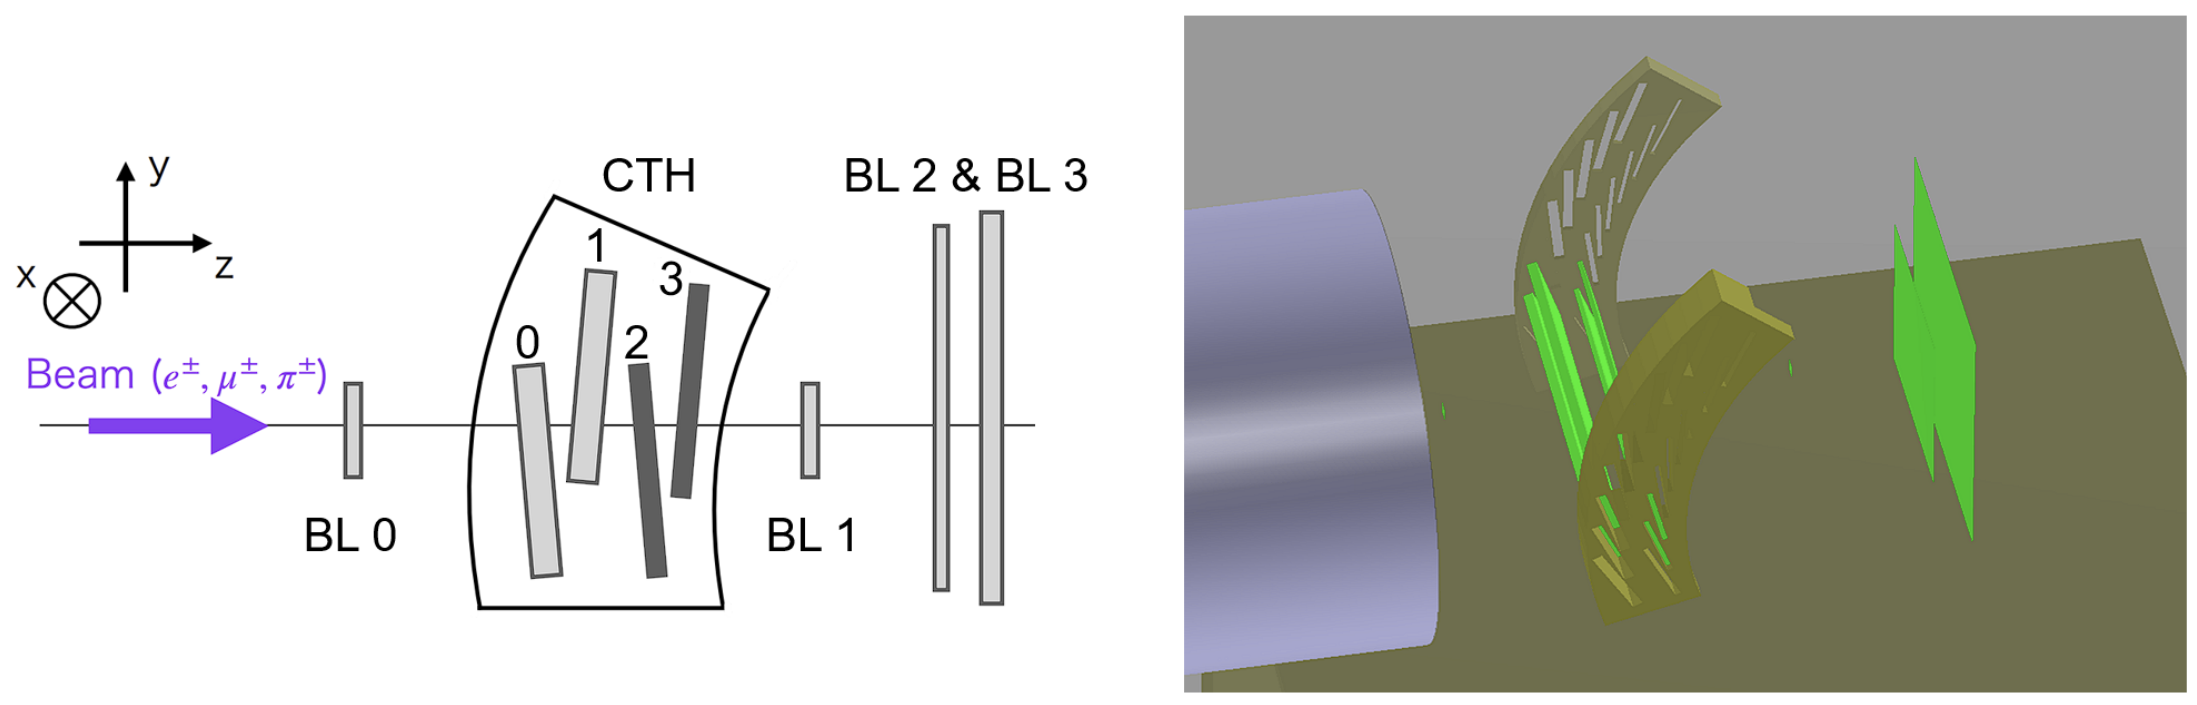
The CTH detector sits at both ends of the Cylindrical Drift Chamber (CDC) in CyDet. It provides precise hit timing to complement the CDC's momentum measurement, and implements a 4-fold coincidence trigger to suppress false triggers. Each CTH consists of two concentric rings of 64 scintillator pairs: inner counters (5 × 80 × 360 mm) and outer counters (10 × 88 × 340 mm). This project examined a prototype geometry tested at the Paul Scherrer Institute in November 2023, comprising four CTH counters (CTH 0–3) and four beamline (BL) counters.
The Bethe-Bloch Formula
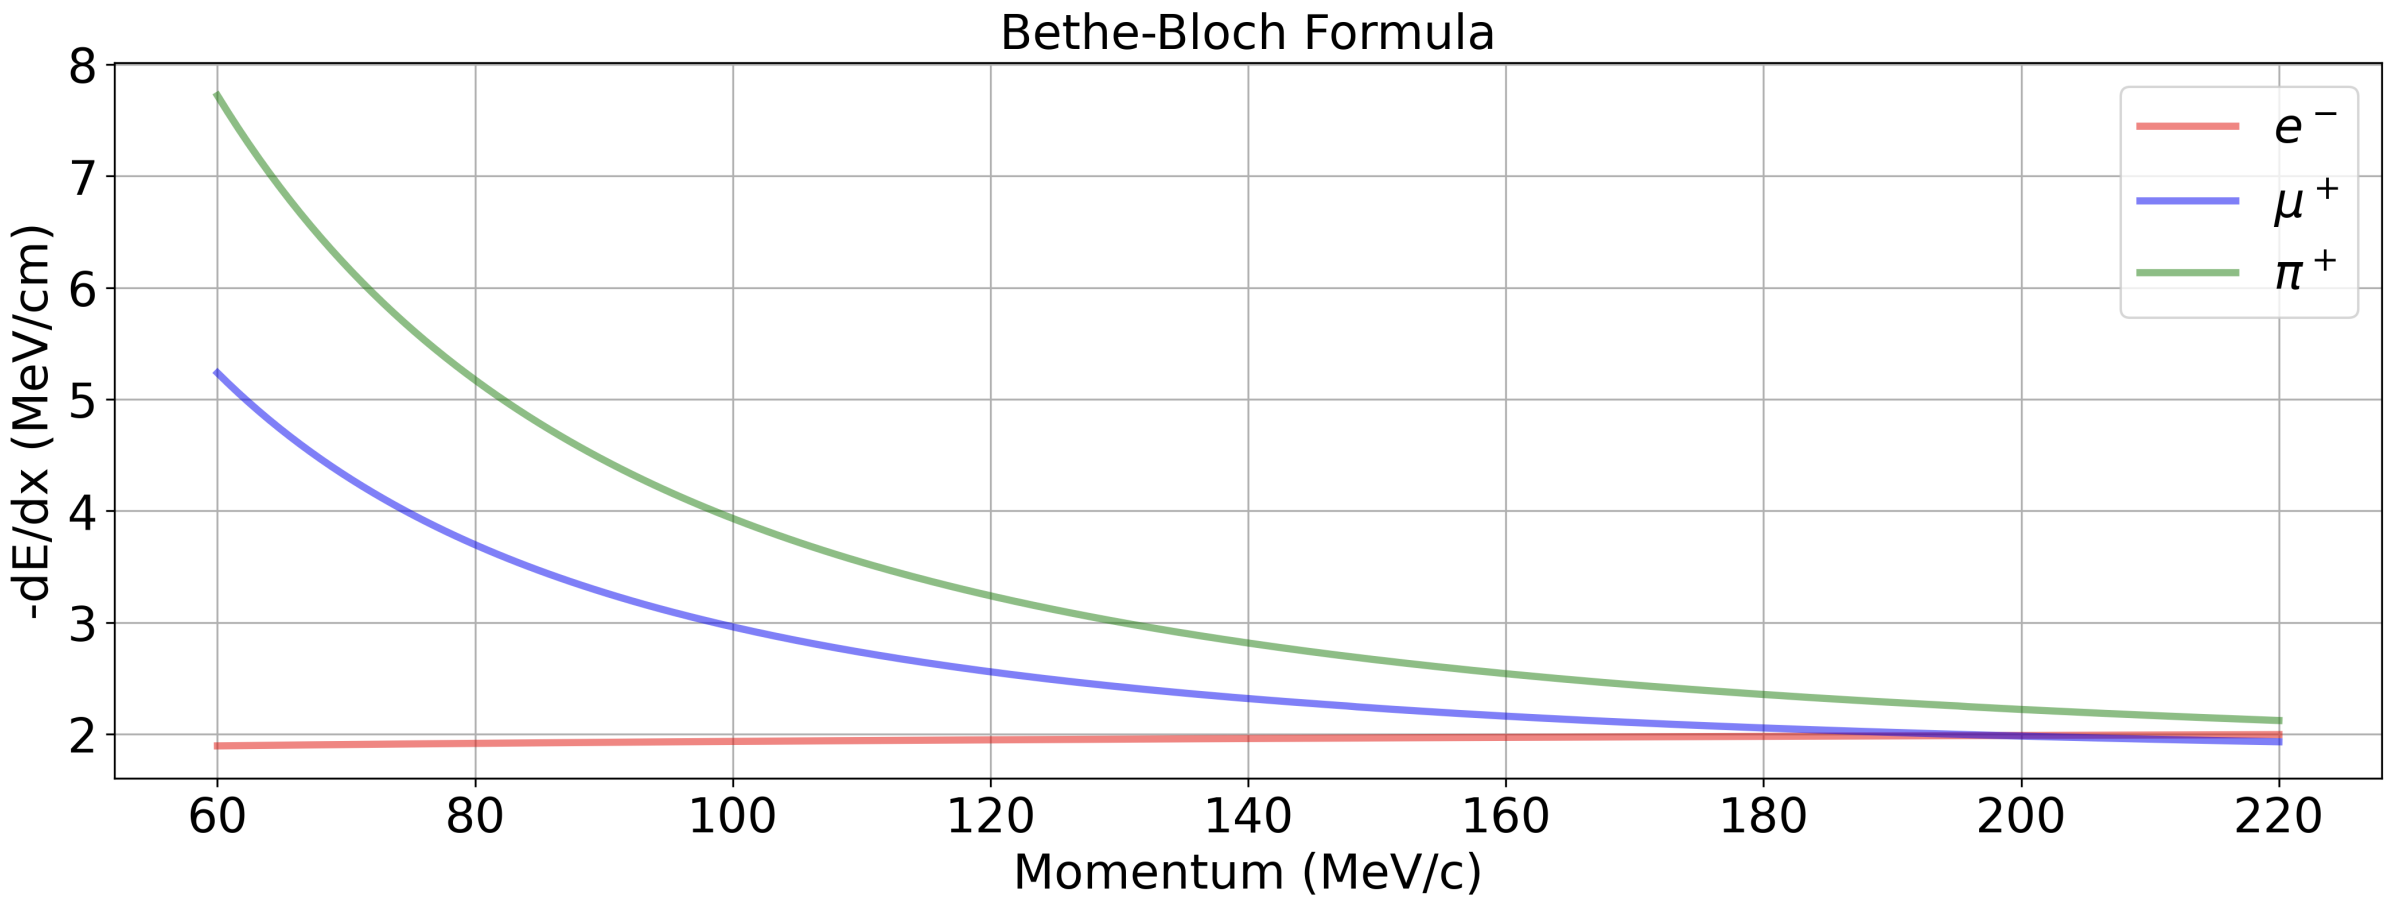
The stopping power — energy deposited per unit path length — of a charged particle travelling through matter is described by the Bethe-Bloch formula:
−dE/dx = 2πNare²mec²ρ(Z/A)(z²/β²) [ ln(2meγ²v²Wmax / I²) − 2β² ]
At the same momentum, heavier particles travel more slowly (smaller β), yielding a larger stopping power. This mass-dependent energy deposition is the physical foundation for particle identification in the CTH. The CTH scintillator material is Polyvinyl Toluene (PVT), with effective atomic number Zeff = 5.665, effective atomic weight Aeff = 11.653, density ρ = 1.032 g·cm⁻³, and mean excitation potential I = 64.7 eV.
Simulation Setup
Simulations were performed using a Geant4-based framework (IceDust/COMET Offline Software) replicating the Paul Scherrer Institute prototype test geometry. The geometry comprises four CTH counters and four beamline (BL) counters along the z-axis; the beam enters from the left.
| Counter | Type | Thickness | Angle from z-axis | Expected path length |
|---|---|---|---|---|
| CTH 0 | Outer scintillator | 10 mm | 68.5° | 10.748 mm |
| CTH 1 | Outer scintillator | 10 mm | 74° | 10.403 mm |
| CTH 2 | Inner scintillator | 5 mm | 72° | 5.257 mm |
| CTH 3 | Inner scintillator | 5 mm | 78° | 5.112 mm |
Each simulation runs 50,000 events per particle species per momentum value (12 configurations total), using a Gaussian primary beam position (σ = 10 mm in x and y). Output branches from the ROOT TTree include hit position (x, y, z), timing (t), momentum components (px, py, pz), energy deposition (edep), and path length (len) per counter hit. Data are extracted via PyROOT into JSON for downstream Python analysis.
Stopping power proxy: The energy deposition per unit path length ΔE/Δx = edep / len is used as the simulation's approximation of the Bethe-Bloch stopping power dE/dx, since the CTH scintillator counters are thin enough that momentum does not change significantly within one counter.
Analysis Methods
Landau and Moyal Distributions
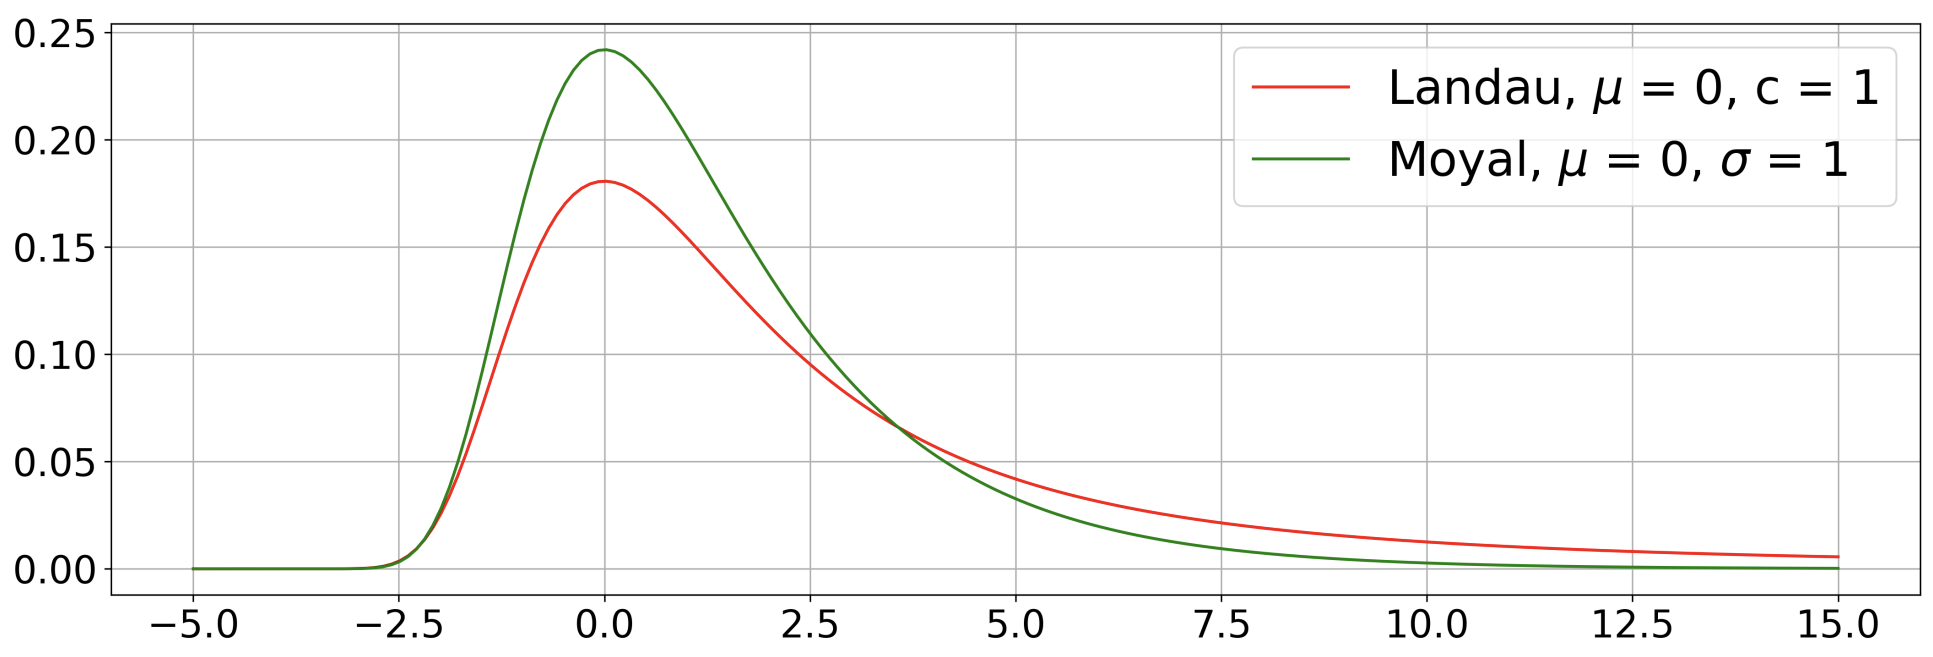
Energy deposition in a thin absorber follows a Landau distribution — characterised by a sharp rise to a most-probable value (MPV) and a heavy tail from rare high-energy transfers (delta-rays). The Moyal distribution is an analytic approximation of the Landau that becomes exact in the limit of large mean collision number Q ≥ 20:
- Landau — favoured when Q is small (thin detectors, few collisions per traversal); exhibits a stronger tail.
- Moyal — favoured when Q is large (thicker detectors); slightly more symmetric than Landau.
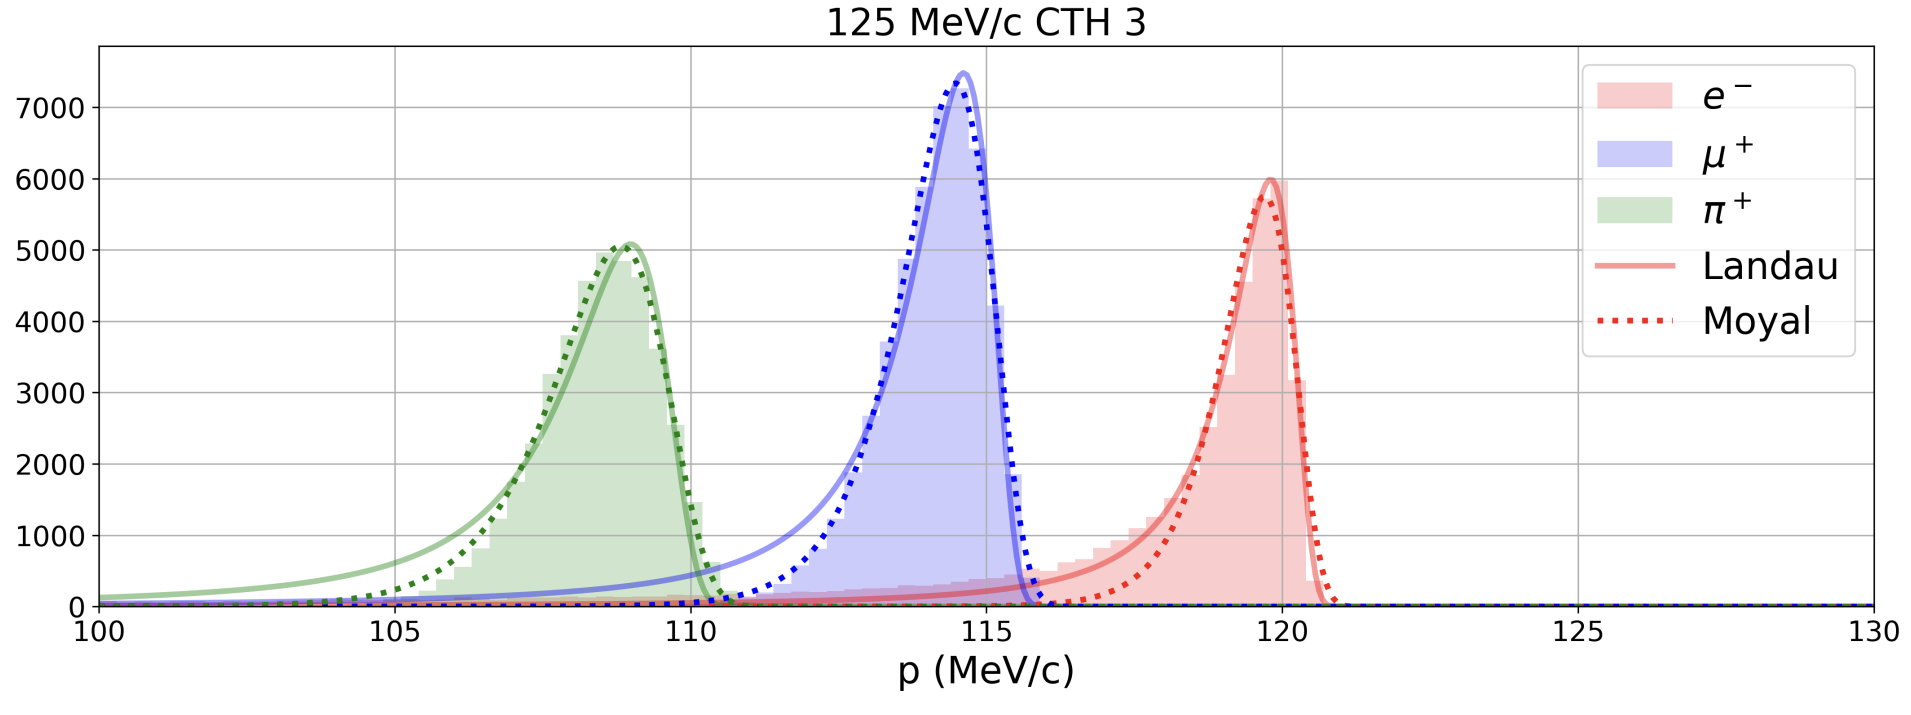
Both distributions are fitted to p and ΔE/Δx histograms. For the momentum distributions the distributions are flipped horizontally (since momentum decreases as energy is deposited). The better fit is selected per histogram using a chi-squared comparison:
χ² = Σ (Oi − Ei)² / Ei
The fitted MPV from the winning distribution is then the representative value for that histogram, extracted via Python's scipy.optimize.curve_fit.
Results
Impact Location Distributions
The x and y impact positions at each CTH counter are approximately Gaussian for all three particle species and all momenta. This follows from (1) the Gaussian primary beam profile (σ = 10 mm) and (2) the central limit theorem applied to random multiple scattering. Heavier particles consistently show wider Gaussian widths (larger σ), as quantified by Gaussian fits.
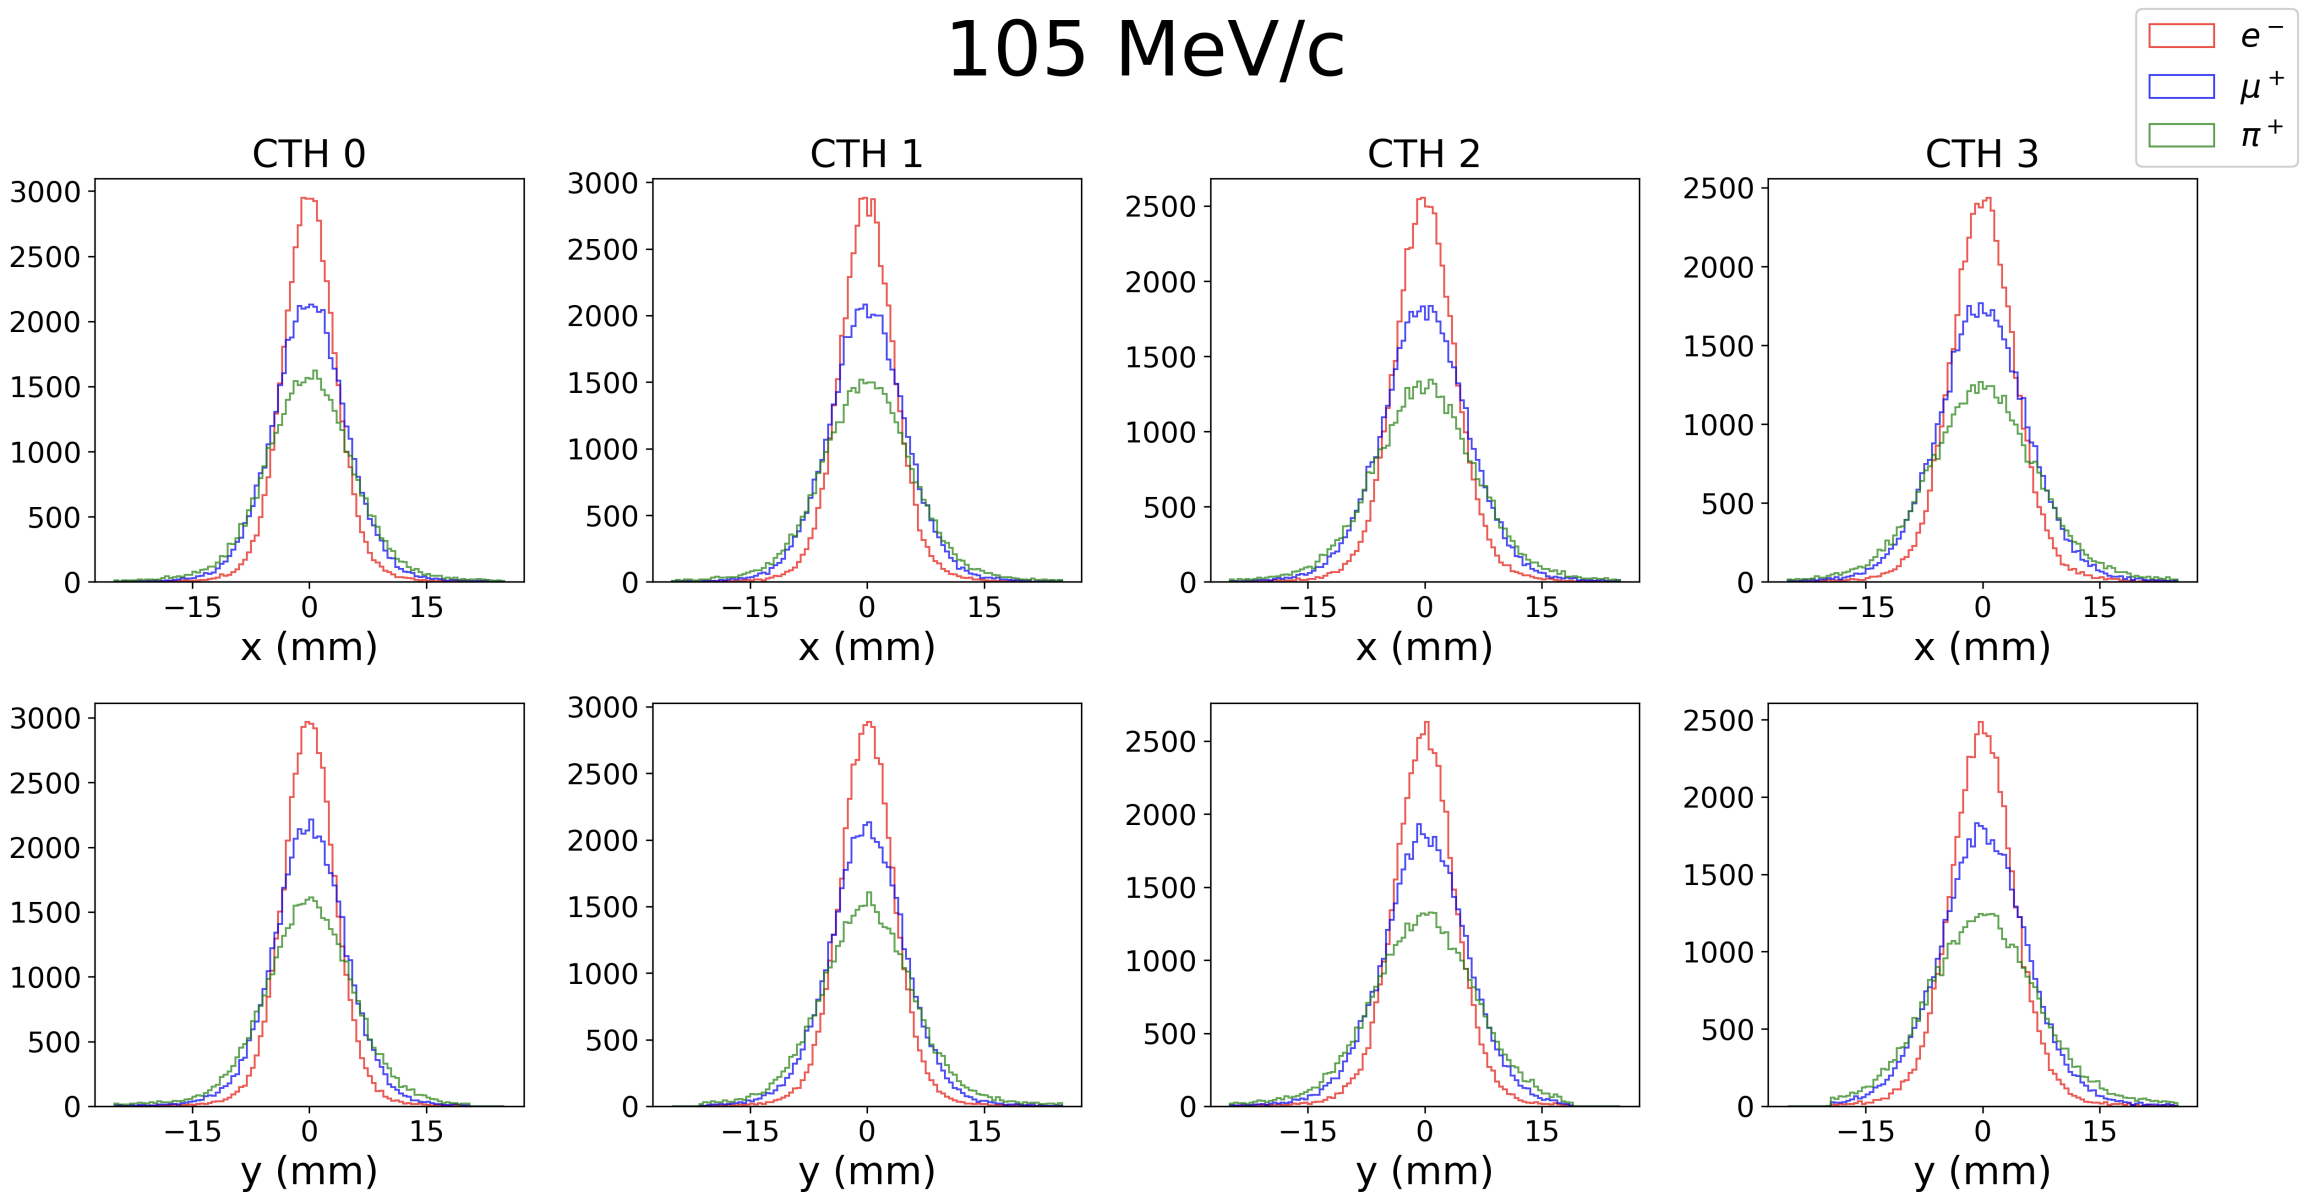
| Particle | σx at CTH 0 (mm) | σx at CTH 3 (mm) |
|---|---|---|
| e⁻ | 3.31 ± 0.01 | 4.03 ± 0.02 |
| µ⁺ | 4.55 ± 0.02 | 5.60 ± 0.03 |
| π⁺ | 5.37 ± 0.03 | 6.68 ± 0.04 |
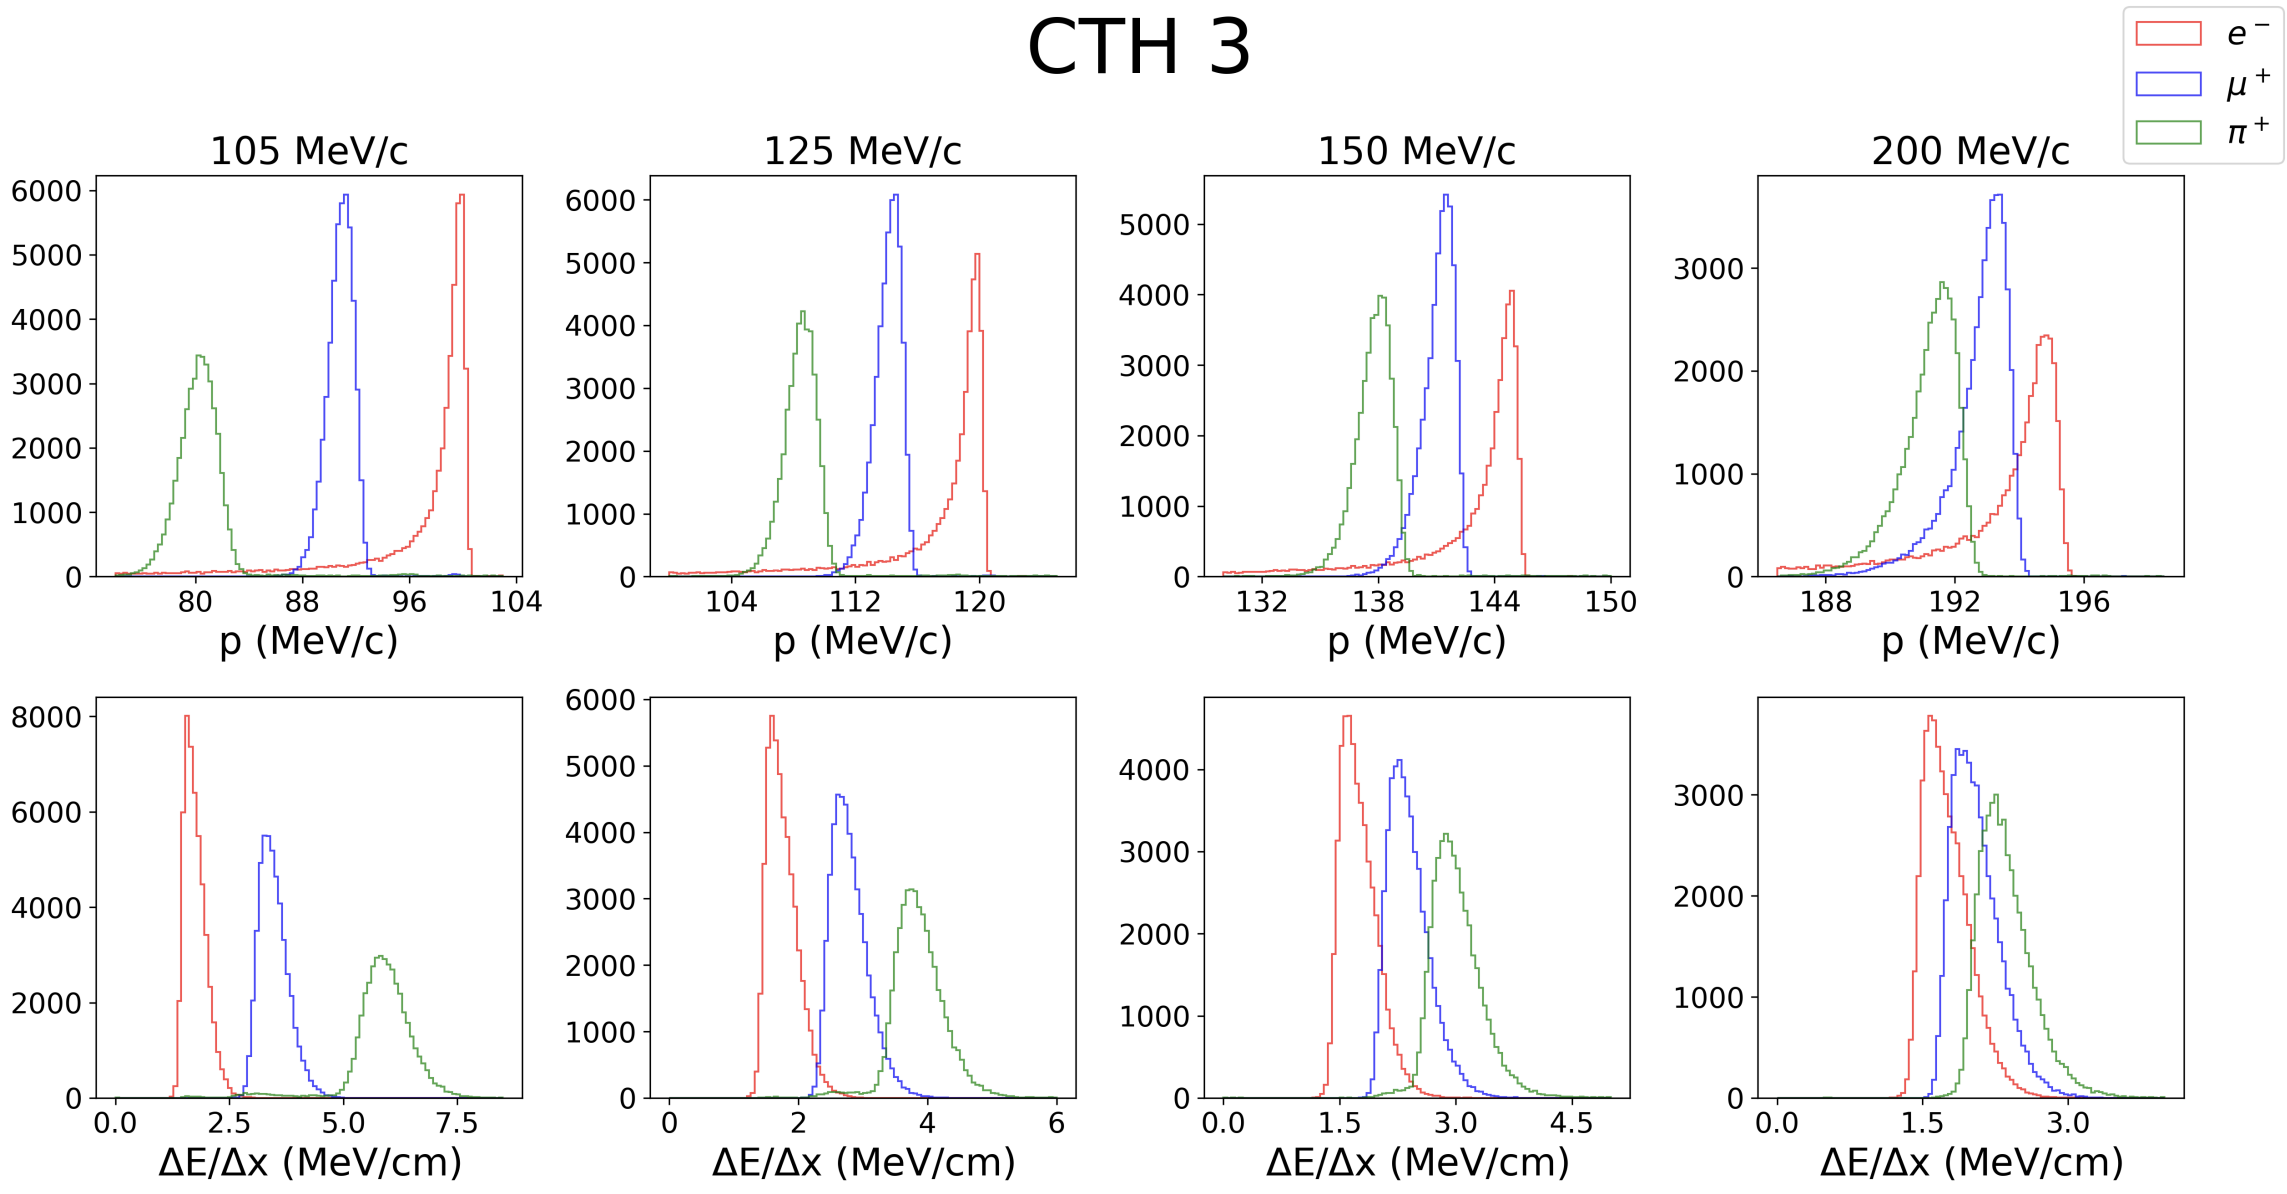
Relativistic scattering hierarchy: At 105 MeV/c, σ(π⁺) / σ(e⁻) ≈ 1.6 in the impact location distribution. As momentum increases to 200 MeV/c, the three distributions converge as all particles approach the same relativistic velocity.
Path Length Distributions
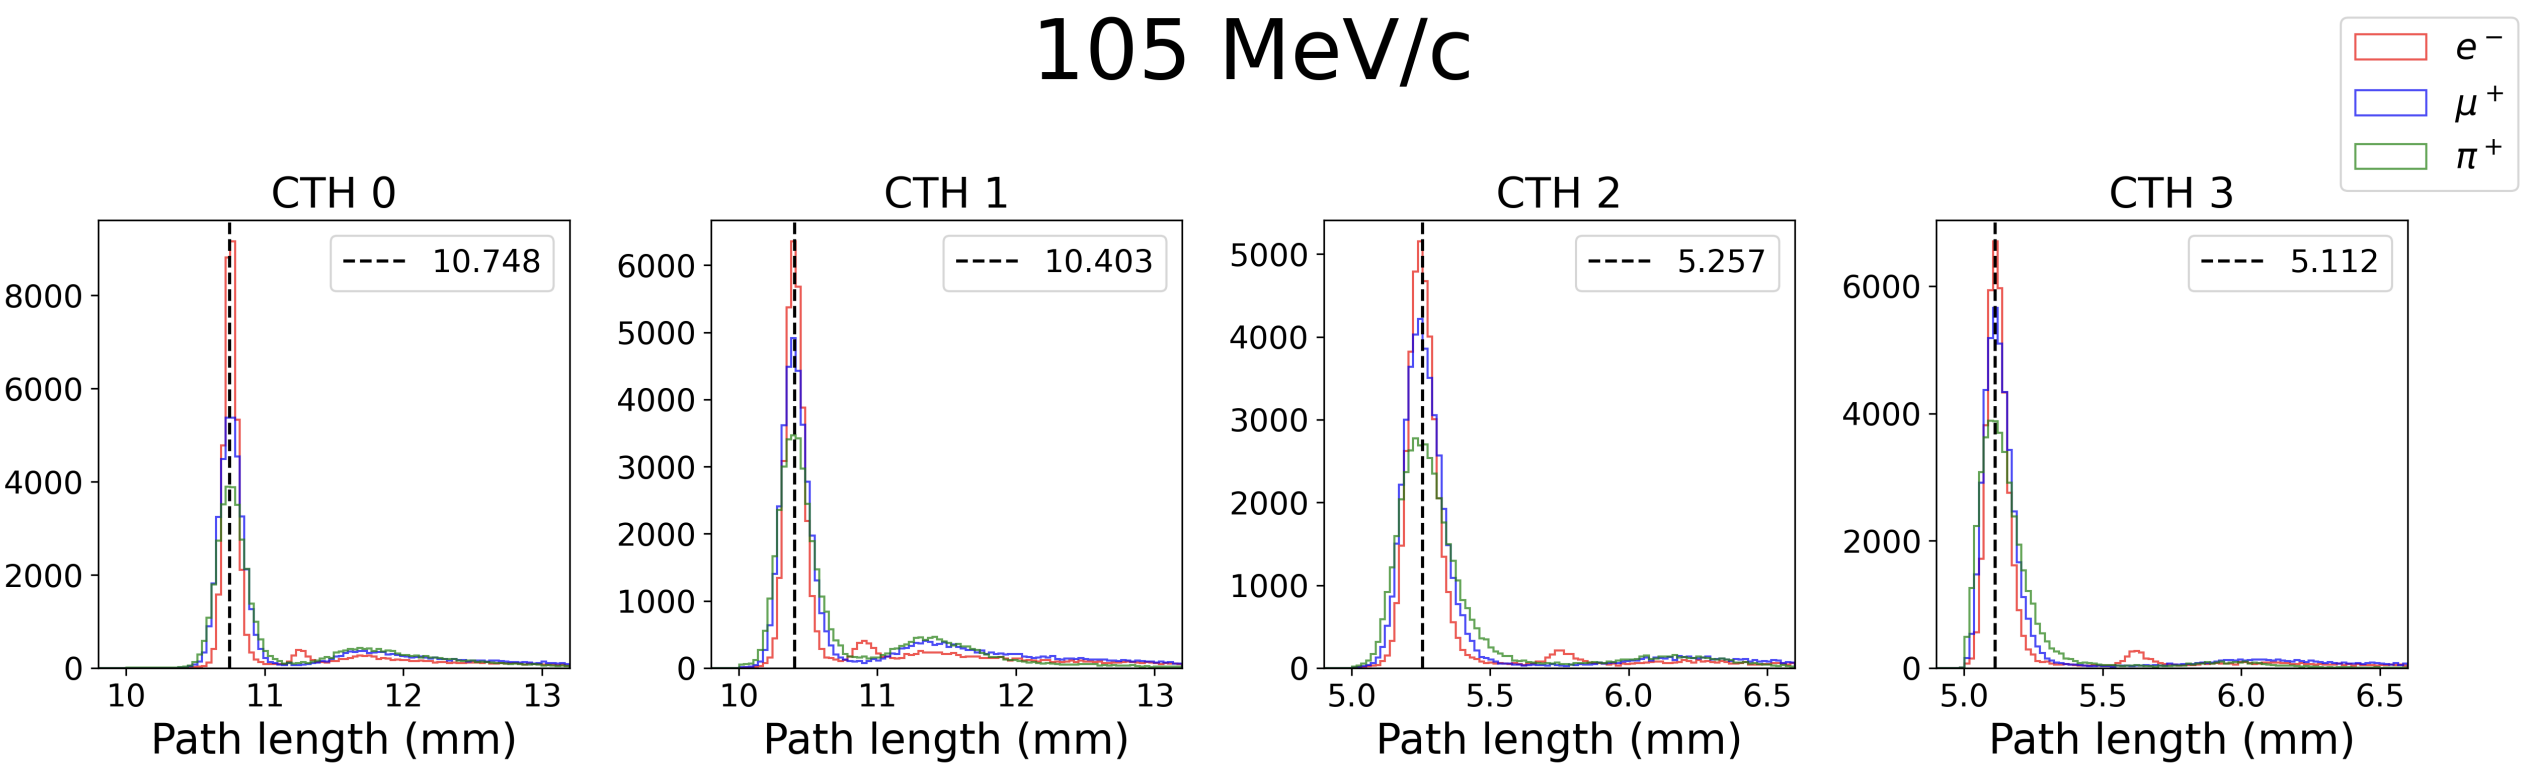
The path length traversed inside each counter peaks at the expected geometric value (counter thickness / cos θ), confirming the validity of the simulation geometry. A secondary peak at larger path lengths appears for all three particles, attributed to elastic nuclear scattering deflecting particles into less-normal incidence angles.
Momentum and Energy Deposition Distributions
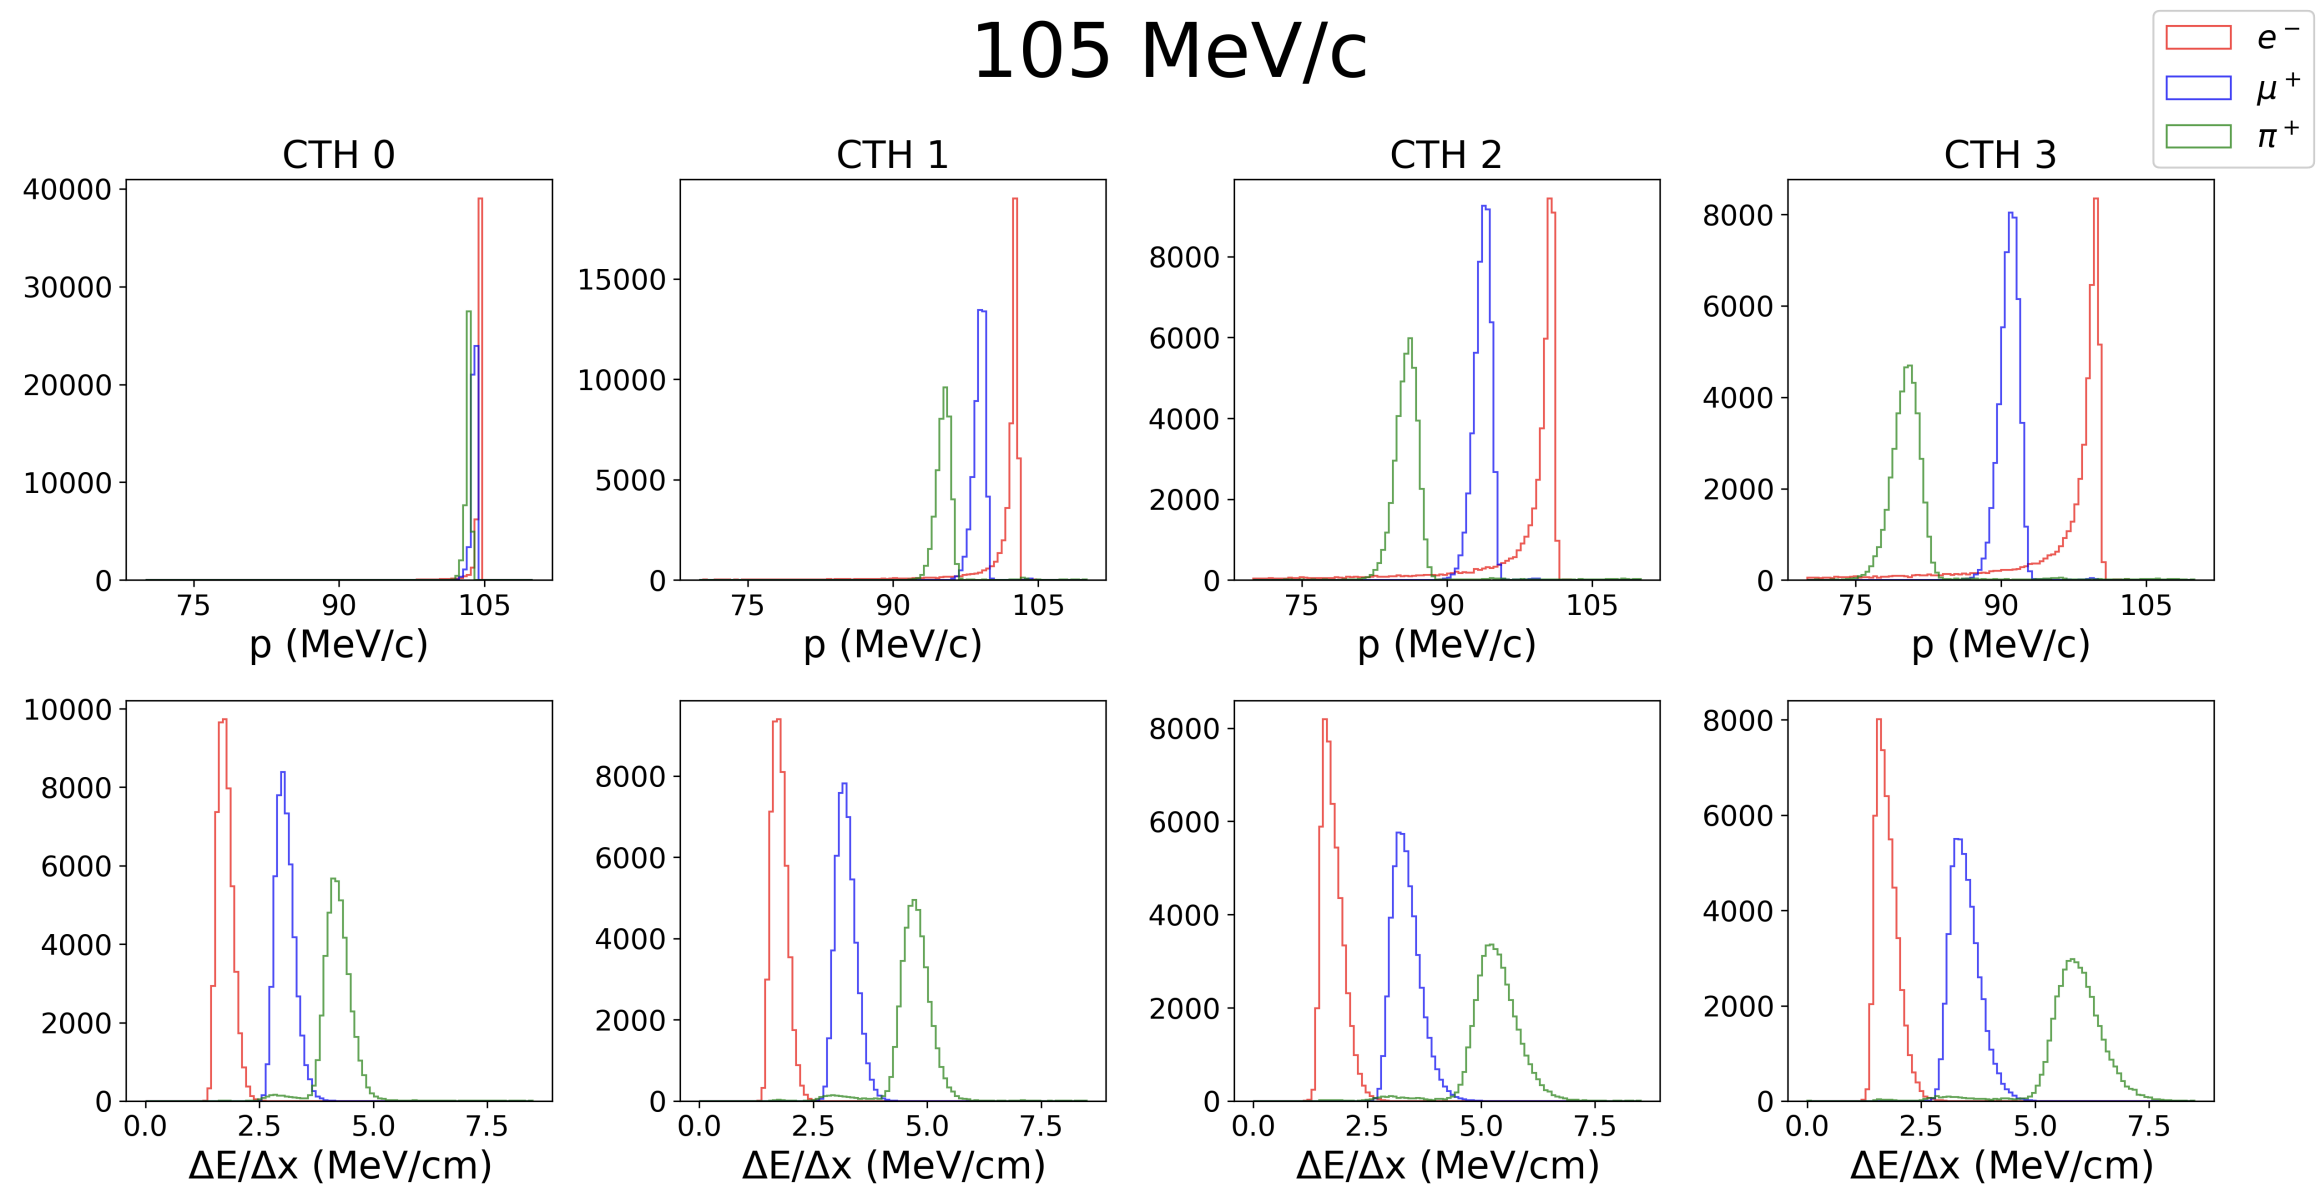
At each counter the simulation records the initial momentum of the particle upon entry. As particles pass through the counters they lose momentum, with heavier (slower) particles losing more. The ΔE/Δx distributions reveal the characteristic Landau-like shape, and are clearly separated between species at 105 MeV/c.
Landau vs. Moyal Fitting Results
For each of the 96 histograms (3 species × 4 momenta × 4 counters × 2 observables), both Landau and Moyal distributions were fitted and their chi-squared values compared. Clear systematic trends emerge:
| Observable | e⁻ preference | µ⁺ preference | π⁺ preference |
|---|---|---|---|
| p at CTH 0 (all momenta) | Landau | Landau | Landau |
| p at CTH 1–3, 105 MeV/c | Landau | Moyal | Moyal |
| p at CTH 1–3, 200 MeV/c | Landau | Landau | Landau / Moyal |
| ΔE/Δx (all counters, all momenta) | Moyal | Moyal | Moyal |
Physical interpretation: ΔE/Δx always favours Moyal because the relatively thick scintillators (5–10 mm) produce large mean collision numbers Q > 20 for all particles. For momentum distributions, lighter and faster e⁻ interacts less with each counter (relativistic suppression), preserving the thinner-detector Landau character throughout the detector stack.
Fitted MPV Values vs. Bethe-Bloch Predictions
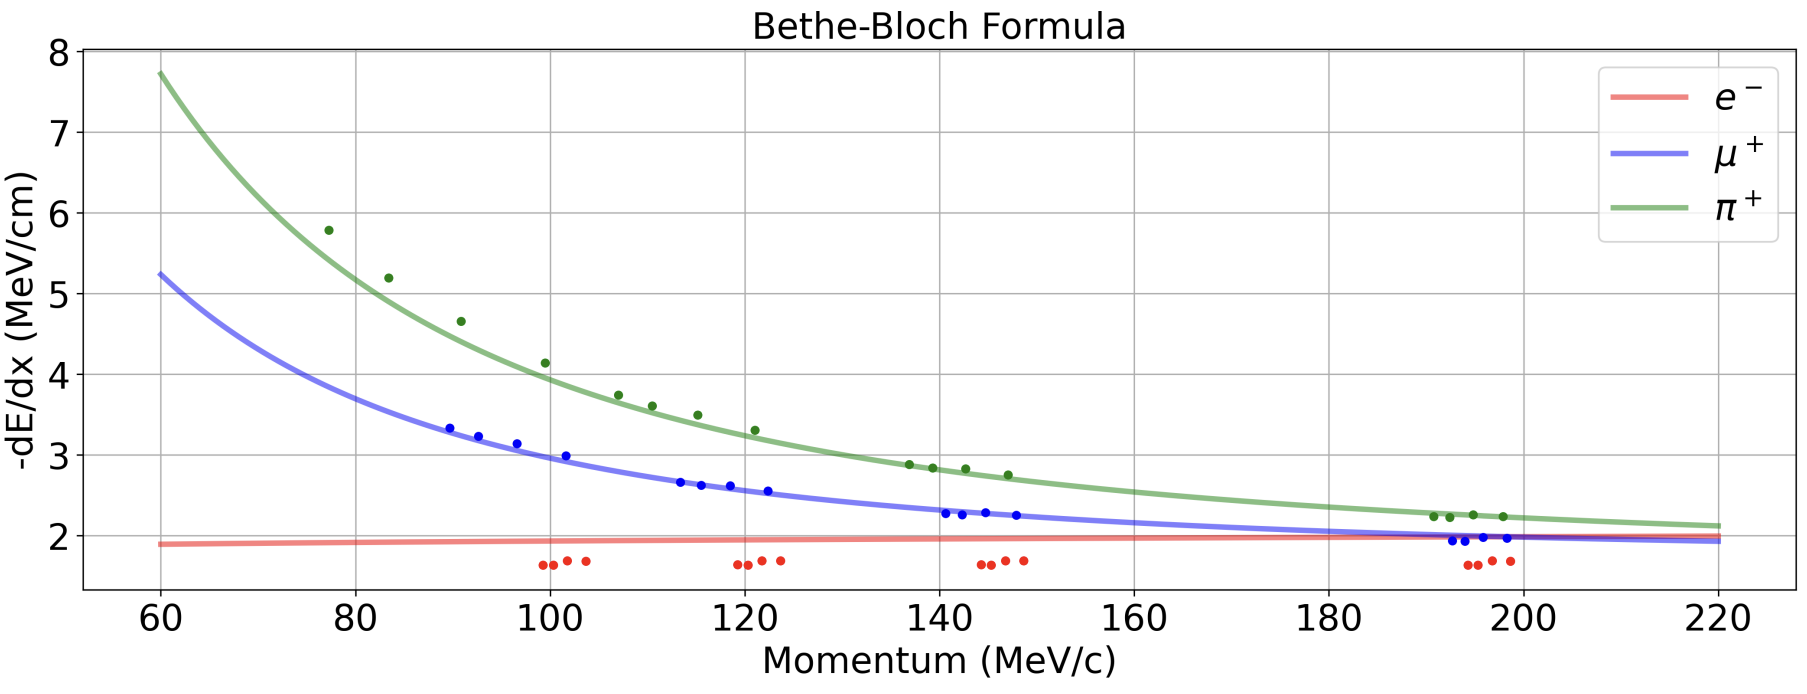
The MPV from each best-fit distribution is plotted as the representative stopping power for each (particle, counter, momentum) combination, then overlaid on the Bethe-Bloch formula curves.
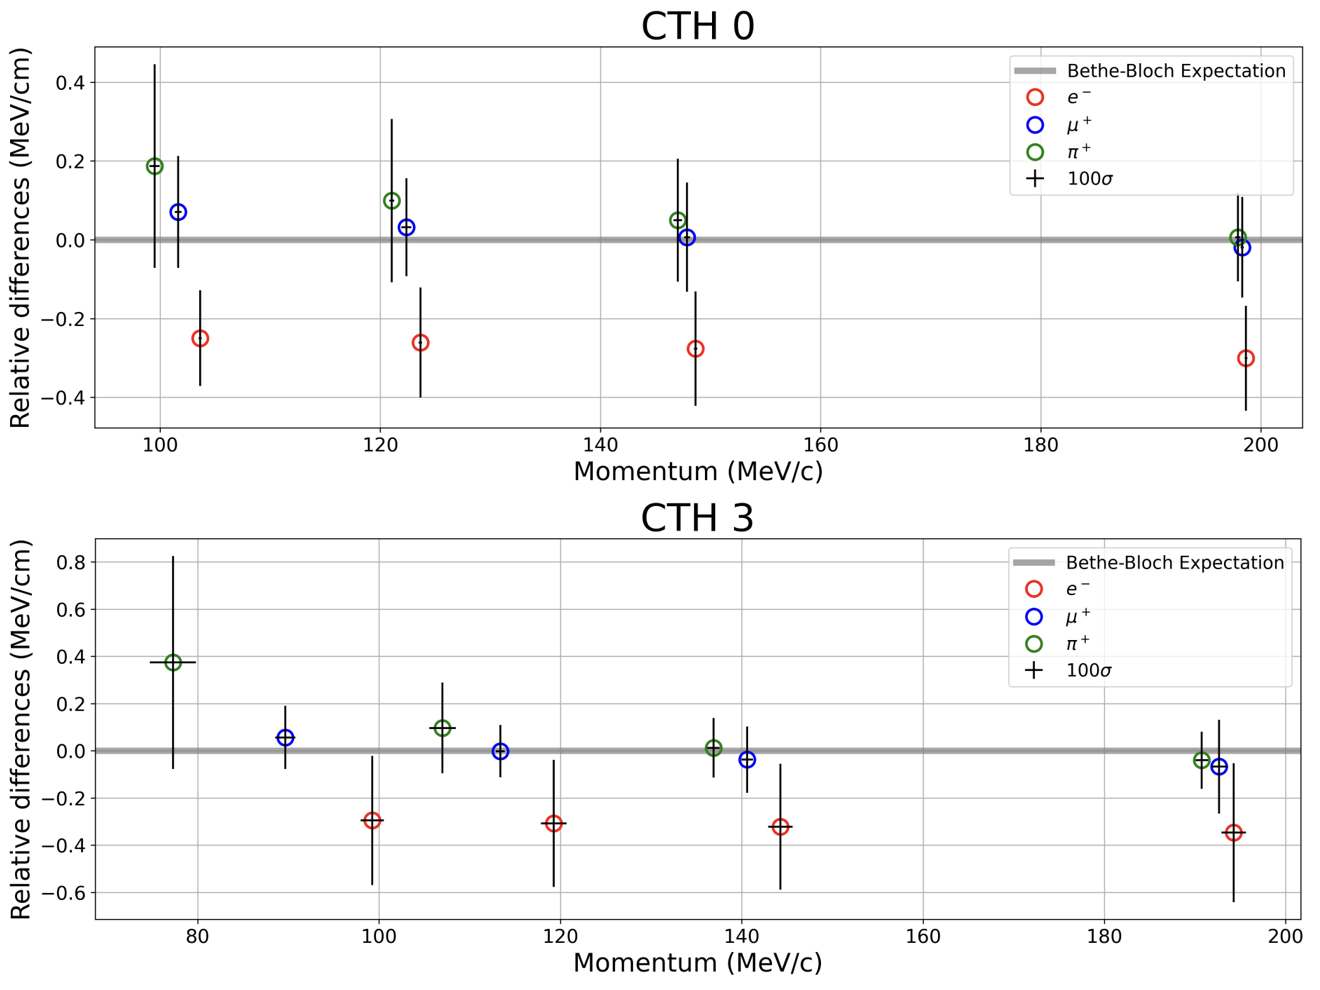
The two main systematic discrepancies are physically well-motivated:
- e⁻ downward offset (~0.3 MeV/cm): The Geant4 analysis records delta-rays (ionised secondary electrons) as part of the primary e⁻ track, inflating the apparent path length and thereby reducing the computed ΔE/Δx. A refined track-filtering algorithm is needed to separate primary and secondary trajectories.
- π⁺ upward offset at 105 MeV/c: At 105 MeV/c, π⁺ travels at v ≈ 1.8×10⁷ m/s, taking ~2 ns to traverse the detectors — comparable to its mean lifetime of 26 ns. A fraction of pions decay mid-detector (π⁺ → µ⁺ + νµ), producing a lower-momentum µ⁺ that deposits more energy than the original π⁺, biasing the ΔE/Δx distribution upward. At higher momenta, relativistic time dilation reduces the decay probability.
Summary
CTH confirms particle identification at 105 MeV/c: At the COMET signal momentum, e⁻ is cleanly distinguishable from µ⁺ and π⁺ in both energy deposition (ΔE/Δx ≈ 1.7 vs. 3.0 vs. 4.1 MeV/cm) and momentum loss rate. The distributions are well-separated at CTH 3 even after starting from similar values at CTH 0.
Moyal is the universal ΔE/Δx model: The Moyal distribution fits all energy deposition distributions across all particles and momenta, because the 5–10 mm scintillator thickness produces Q > 20 mean collisions per traversal. For momentum distributions, lighter and faster e⁻ retains Landau character throughout the detector stack while heavier particles transition to Moyal.
Bethe-Bloch formula validates the simulation: Fitted MPV values track the theoretical stopping power curves for µ⁺ across the full 105–200 MeV/c range. Systematic offsets for e⁻ (delta-ray contamination) and π⁺ at low momentum (in-flight pion decay) are quantified and physically explained.
Path length geometry confirmed: Primary peaks in all path length distributions align with expected geometric values (counter thickness / cos θ), validating the Geant4 setup. Secondary peaks are consistent with elastic nuclear scattering, and e⁻ shows an additional intermediate peak attributed to delta-ray path length contamination.
This work provides a quantitative baseline for CTH detector response that will be directly compared with beam-test data from the November 2023 Paul Scherrer Institute run. The analysis pipeline — ROOT TTree extraction via PyROOT, Landau/Moyal fitting with chi-squared model selection, and Bethe-Bloch cross-validation — is designed to be reusable for future COMET Phase-I data analysis once the experiment begins operation.
All Research